
#124: 2Q25 AdTech, MarTech, Agency Update
Equal-dollar portfolio update; Revealed preferences; Media money flows
With 2Q25 earnings now behind us, we can take stock of how public adtech companies are navigating a market increasingly defined by channel shift and heightened investor scrutiny.
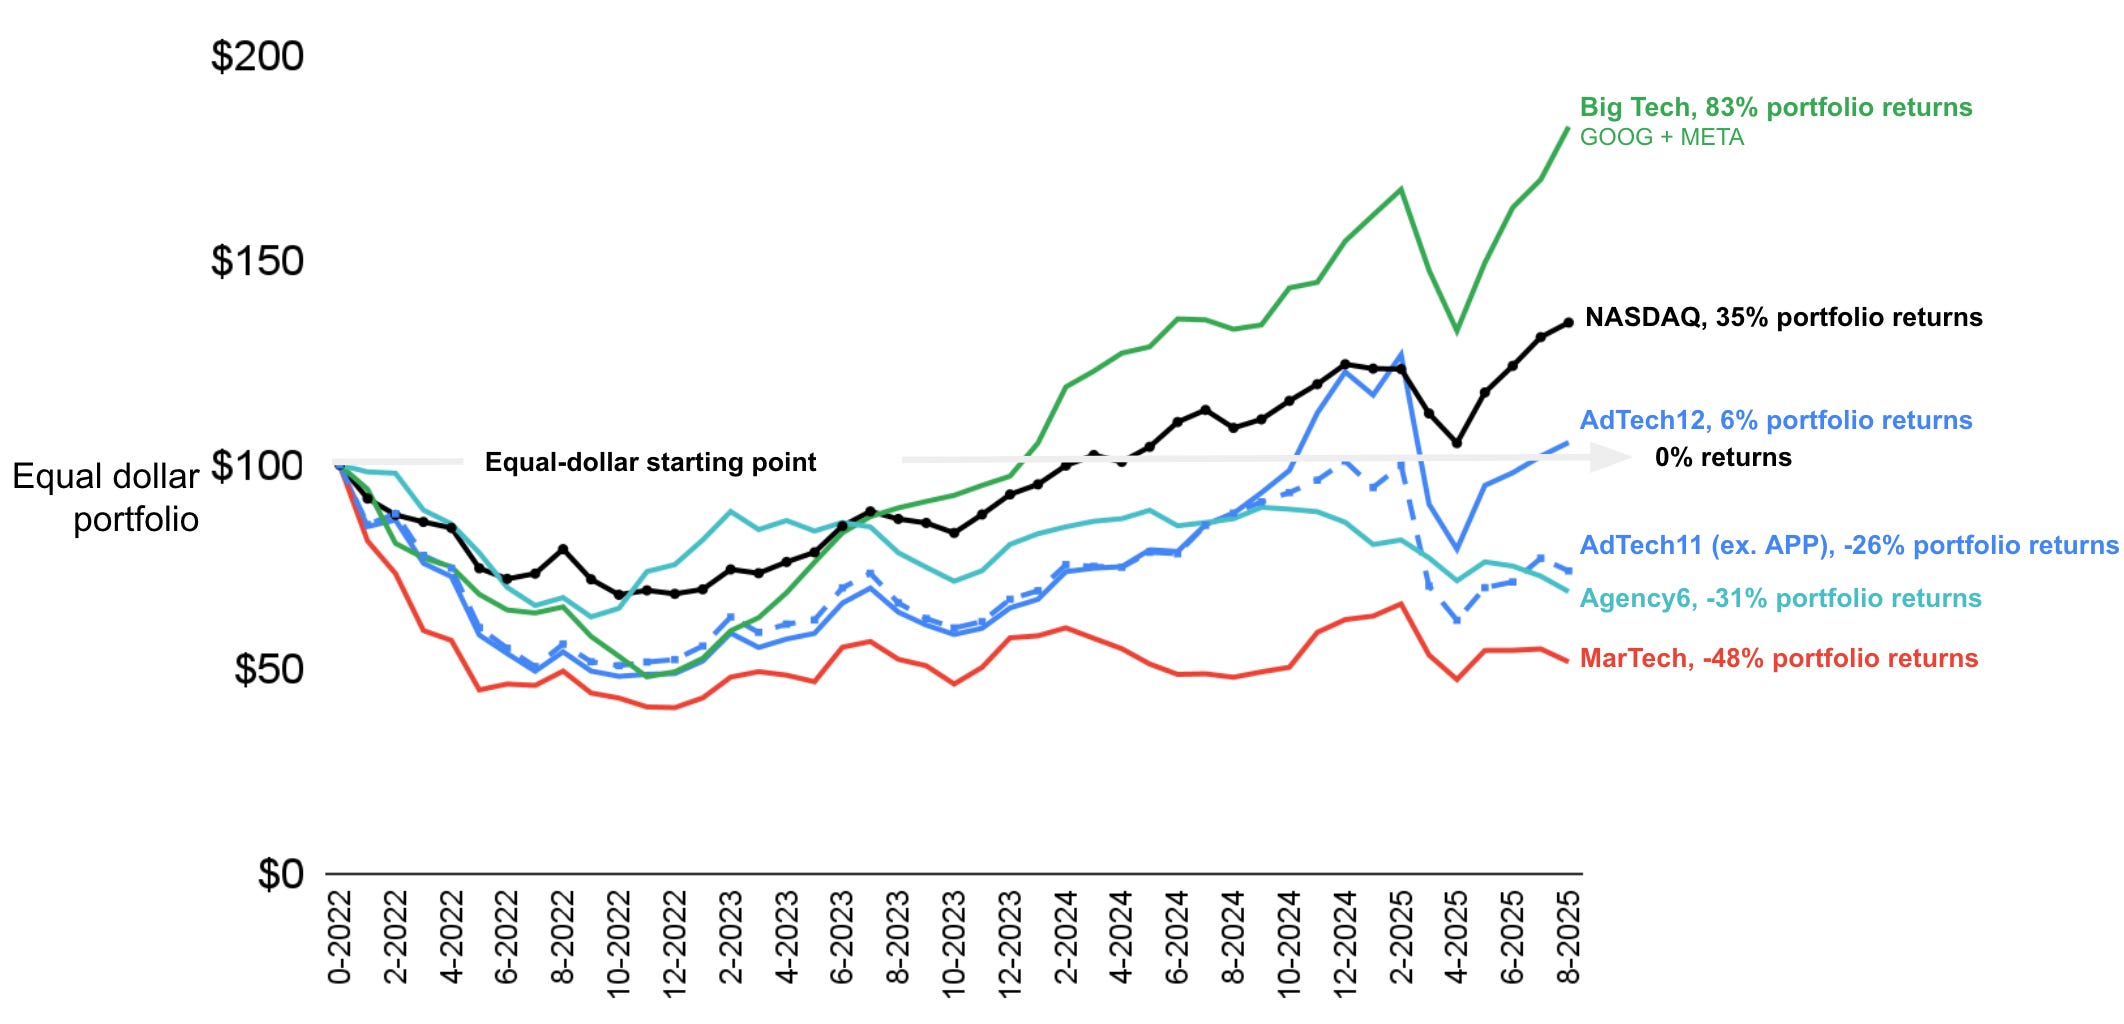
In this update, we reconstructed our equal dollar portfolio to start on January 1, 2022. That’s a good starting point since all the companies in our composite view were already public by then.
Here’s how it works using our AdTech12 portfolio as an example. You start with $100, divide it equally across 12 companies (see list below), buy shares in each based on the stock price on January 1, 2022, and hope to find alpha by beating the NASDAQ or S&P500.
AdTech12
Up 6%. Peak returns happened in February 2025, which was on par with the NASDAQ, but the sector has since lost a lot of ground since then.
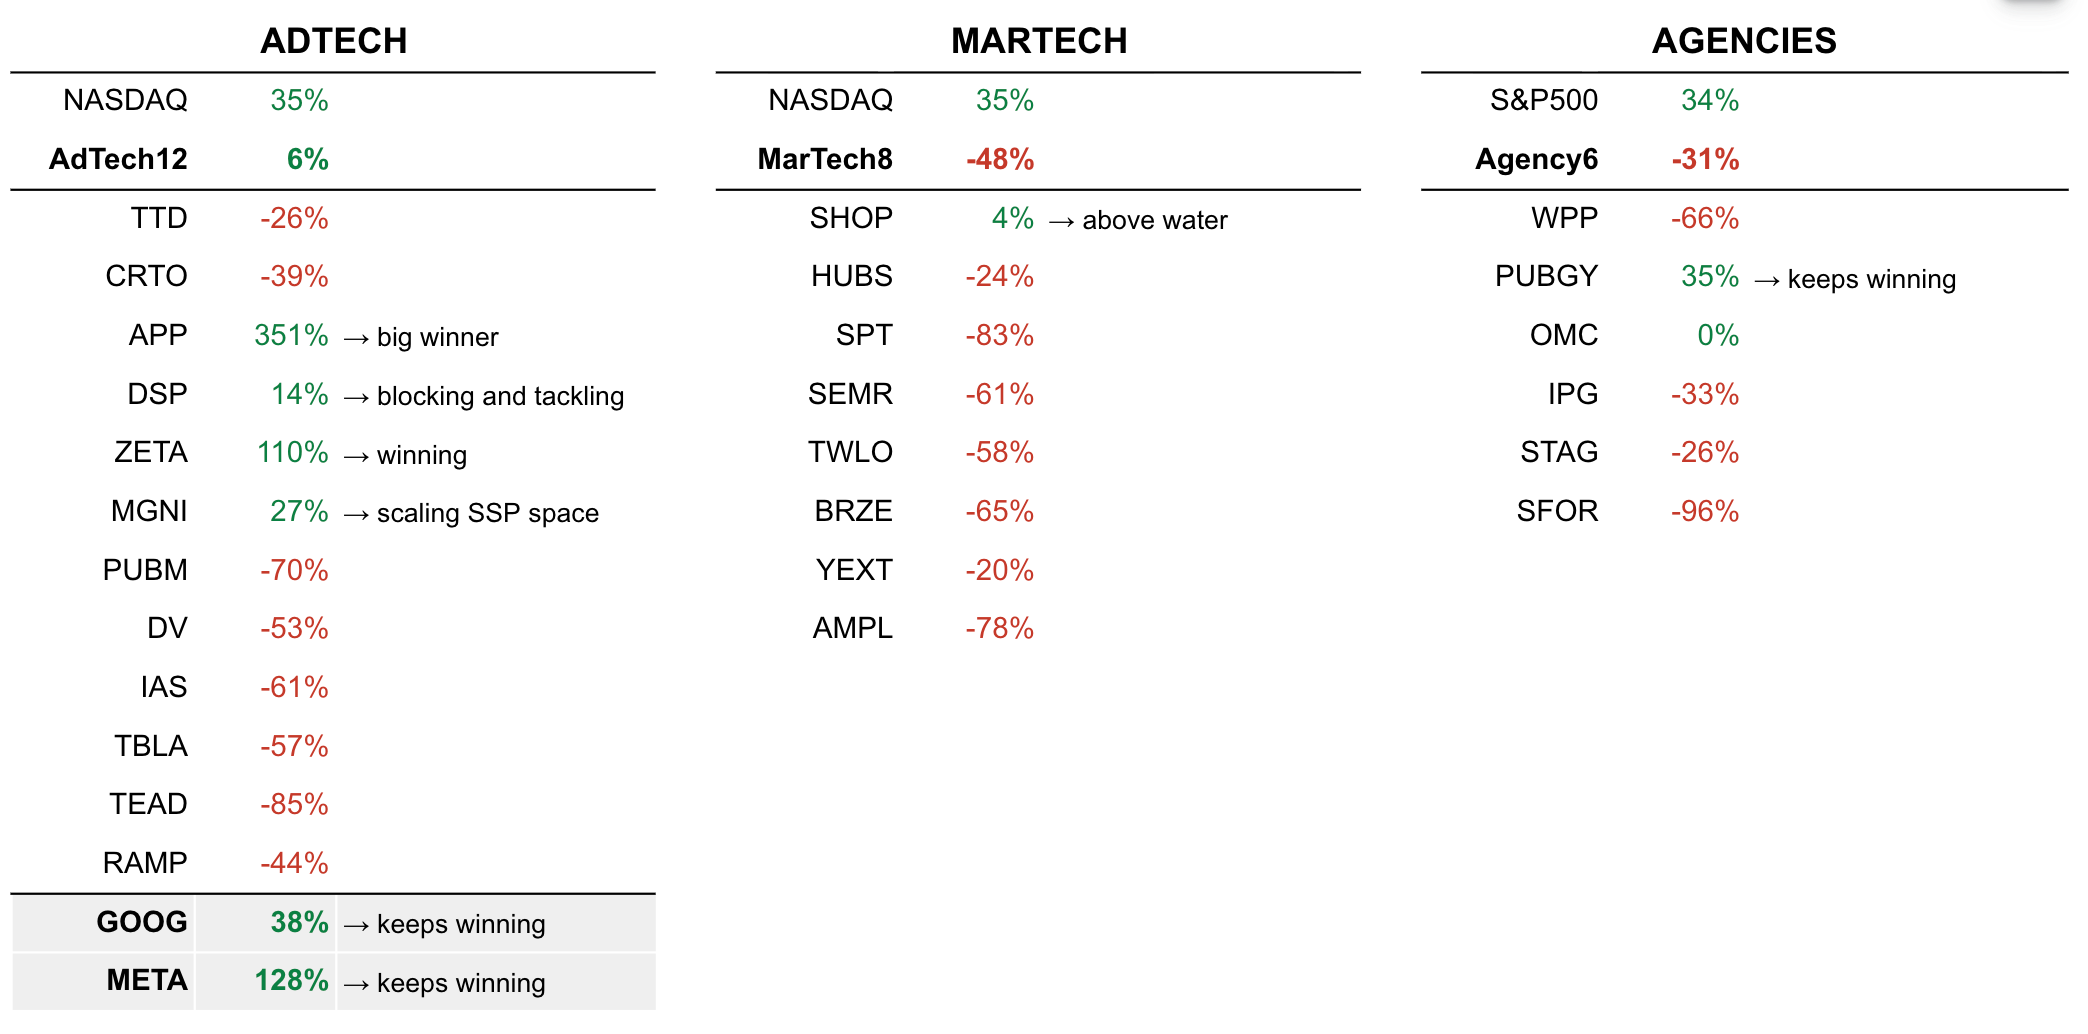
The AdTech12 includes: TTD, CRTO, APP, DSP, ZETA, MGNI, PUBM, DV, IAS, TBLA, TEAD, and RAMP.
The same $100 invested in a NASDAQ ETF would have returned 35%, but then again, you would not need to read Quo Vadis if that were the case 😂
AdTech11
Applovin is the biggest contributor to the overall 6% gains. It’s returned 337% on its own.
If we removed APP from our 12-stock “AdTech” portfolio, we would get the AdTech11 delivering –26% losses.
The other positive performers are Zeta, Magnite, and Viant.
MarTech8
“If software is eating the world,” it’s not happening in the MarTech space.
The MarTech8 is made of: SHOP, HUBS, SPT, SEMR, TWLO, BRZE, YEXT, and AMPL
The only positive story is Shopify (SHOP) delivering 4% gains in an overall portfolio with -48% in losses.
SIDEBAR: If there is one thing that gets our socks in a twist at Quo Vadis, it’s the misguided venture capital believe that SaaS revenue models are superior to business models that leverage media flows. The data says media flow models are much better. Why? Because SaaS contracts need to get renewed which puts downward pressure on customer lifetime due to decreasing switching costs while customer acquisition costs remain the same. In the media world, all boats rise with a rising tide and media spend tends to increase every year in tandum with GDP growth. For example, we’d bet anything that The Trade Desk’s 2018 new customer cohort has 90%+ retention rates with active spending in 2025. If you take TTD’s fees earned on that media spend and divide by the number of 2018 customers, we bet you’d see a fantastic and far superior to ARPU compared to most MarTech players.
Agency6
Our agency portfolio consists of: WPP, Publicis, Omnicom, IPG (soon to be OMC-IPG), Stagwell, and S4 Capital.
As you can see from the chart, the agency space has been tough sledding except for Publicis. Publicis is the biggest winner and is making the most moves.
As we’ve pointed out in previous posts, the key to winning in the agency world is the difference between being a landowner and a farmer. A landowner collects rent (revenue and profits) from farmers who pay rent. Landowners who own the highest quality land (data and data capabilities) extract the highest rents because farmers (advertisers) looking for productive gains will beat a path to their door and bid up the rents they are willing to pay. That’s precisely why Publicis is winning in our view. And it’s also why we like independent agency growth prospects in the age of AI/agentic. If we had to bet, we’d expect to see an M&A uptick across the legacy agencies looking to acquire the best independent agency (new landowners). The same thing happened in the dotcom days when large “traditional" agencies bought digital shops like ModemMedia, AvenueA/Razorfish, etc.
Big Tech
There are only two “Big Tech” players (Google and Meta ) in the ad space, with a third one on the rise (Amazon, see below).
Had you invested $100 in GOOG and META on a 50/50 basis in January 20202, you’d be up 83%.
We expect the Big 3 to grow their share from ~48% today to ~70% in 2029. Grow rates are in the mid to high teens. We don’t see that changing much as advertisers gravitate toward what they perceive to be the safest and most scaled alternatives to achieve their reach and frequency goals.
Leaderboard Summary
Advertiser Revealed Preferences
How do you know if an advertiser needs your advertising product more than other alternatives? In the media world, the product is some combination of data/audience/inventory (input) and ROI (output).
In the finance business, ROI is unambiguous. You invest a dollar and get more than a dollar, less than a dollar, or the same dollar back in your bank account. In the advertising business, ROI can be real if the measurement is good, or it can be imaginary because perceptions can be easily shaped by selling into our natural human cognitive biases. It doesn’t really matter which one a buyer wants. What matters more is the ability to sell it again and again.
In any case, when an advertiser needs vs. wants your product, they tend to pay sooner rather than later, which translates into higher returns on invested capital, more cash flow, and higher valuations.
Case and Point:
Big Tech: Advertisers pay Google in 61 days and pay Meta in 45 days. We’d imagine Amazon’s ad products fall somewhere in that range.
AdTech: Across adtech companies that mostly play in the open web publisher world (rectangular ads on websites), their customers pay anywhere from 75 days to 90 days or more.
Economists don’t need to guess what people value; they just watch what they do. If an advertiser needs your product, they reveal that preference in the most unambiguous way possible: they pay you faster than they pay others.
Advertisers pay Big Tech faster because they can’t afford not to. The gap between how quickly (or slowly) advertisers pay Big Tech vs. open web AdTech implies necessity vs. optionality. When your ad product offering shifts from a “nice-to-have” to a “must-have,” advertisers allocate cash more quickly, signaling priority, trust, and dependency.
Media Flows Forecasting: Winners vs. Losers
Adtech valuations won’t move on product roadmaps or narratives; they move on where advertisers actually allocate budgets. So, if you want to understand where adtech valuations are heading in a zero-sum battle for media dollars, one of the best places to start is by mapping scenarios of future media flows.
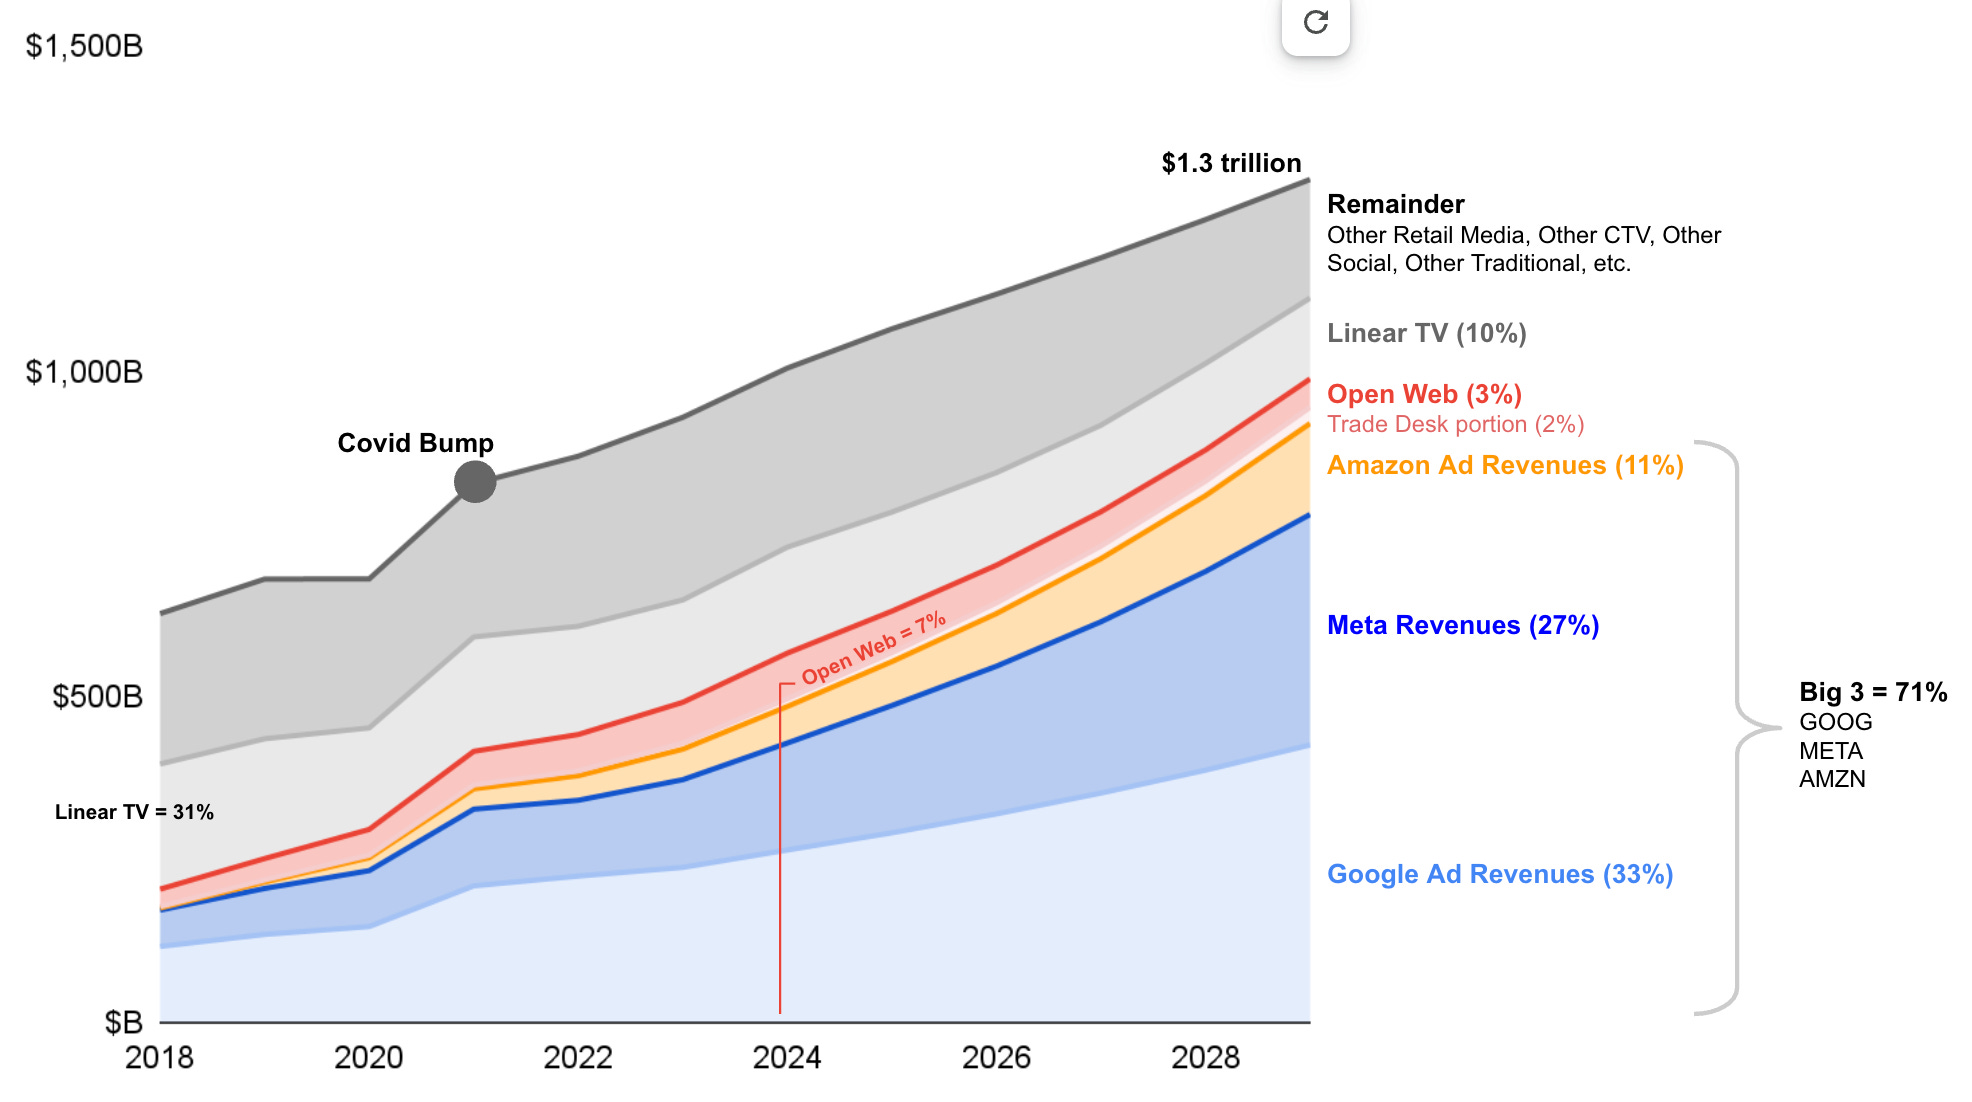
Big 3: The chart above makes the dynamic clear. By 2029, Google, Meta, and Amazon are projected to capture 71% of global ad spend. We start with actual media flows to the Big 3 in 2024 and grow them by 10%, 16% and 20% per year through 2029, respectively. (See Quo Vadis #91: Open Web Market Sizing for our 2024 media flow analysis).
Growth across the Big 3 is fueled by the structural advantages of being a landowner (dataowner) vs. a farmer or farming services company. These three players have the most productive data (land), so advertisers keep bidding up what they are willing to pay for it (data, inventory, and ROI). Observation suggests the Big 3 are increasingly captivating advertisers with closed-loop attribution, massive user bases, AI prowess, and high-quality audience signals, resulting in the aforementioned cash cycles that reveal necessity over optionality.
Open Web: Contrast that with the open web. With 7% of the pie in 2024, the open web — built on website ad inventory and turbulent identity resolution — is sliding toward a 3% share by 2029 as money moves to better or new alternatives. For instance, every time a user spends a minute with GenAI, the open web loses a minute. That means thousands (if not more) of bid requests don’t happen in the ad exchange between DSPs, SSPs, and all the marketplace players associated with that activity.
The Trade Desk is poised to be the standout winner in the open web space. Besides its growth endeavors to play in the open CTV space (excl. Amazon, Netflix, and YouTube locked up inventory), TTD stands to gain more land as the open web shrinks. Assuming 16% average growth rates over the next few years, TTD will attract $25 billion in gross ad spend ($12 billion in 2024) and double its media flows share from 1% to 2%.
Follow the flows
The moral of the story that emerges from our portfolio tracking is less about individual stock performance and more about revealed preferences and structural advantages that separate winners from the rest of the pack. It is through the language of cash cycles and budget allocations that advertisers are telling us what ad products they need now and in the future versus what products they can live without. Big Tech is pulling away because necessity trumps optionality, while much of adtech on the open web seems to be getting further trapped in a lower priority category.
As media flows consolidate into the hands of the Big 3 and concurrently shift to the new AI world, the challenge — and the opportunity — for the rest of the industry is to move from thinking like a farmer to becoming a landowner. Those who can cross that divide will earn faster cash, higher valuations, and ultimately, a seat at the table where future ad dollars get served.
Disclaimer: This post, and any other post from Quo Vadis, should not be considered investment advice. This content is for informational purposes only. You should not construe this information, or any other material from Quo Vadis, as investment, financial, or any other form of advice.
Hi Tom, so it seems you’re bearish on open internet but still bullish on The Trade Desk. Am I reading that correctly?