
#130: Updated Media Money Flows
If you haven’t already played Last Media Dollar to decide how you’d spread your media budget across 22 channels, you’re missing out. It’s a ten-minute experience that surfaces hidden preferences and challenges your assumptions about where your last media dollar really belongs. And after you read this post, you might be thinking about it in a whole new way.
Updated Media Money Flows

Last October 2024, we shared our media flows breakdown in Quo Vadis #91. That’s been one of our more popular posts. With almost a year in the rearview mirror, we are updating our media flows into a tighter and more well-defined view across 22 mutually exclusive channels.
Like everything else in advertising, market sizing and segmentation are imperfect exercises meant to provide our readers with a starting point snapshot, and hopefully directionality on where media dollars are flowing to and from in the future.
Let’s take it from left to right across each media channel. We’ll also touch on two emerging areas where eyeballs are increasingly spending more time (GenAI and CTV Wrappers). We’ll also dig deeper into two established growth areas (CTV and Retail Media).
Where necessary, we describe our assumptions and the thinking behind our calculations. We also provide research links in our commentary.
“Traditional” vs. “Digital”
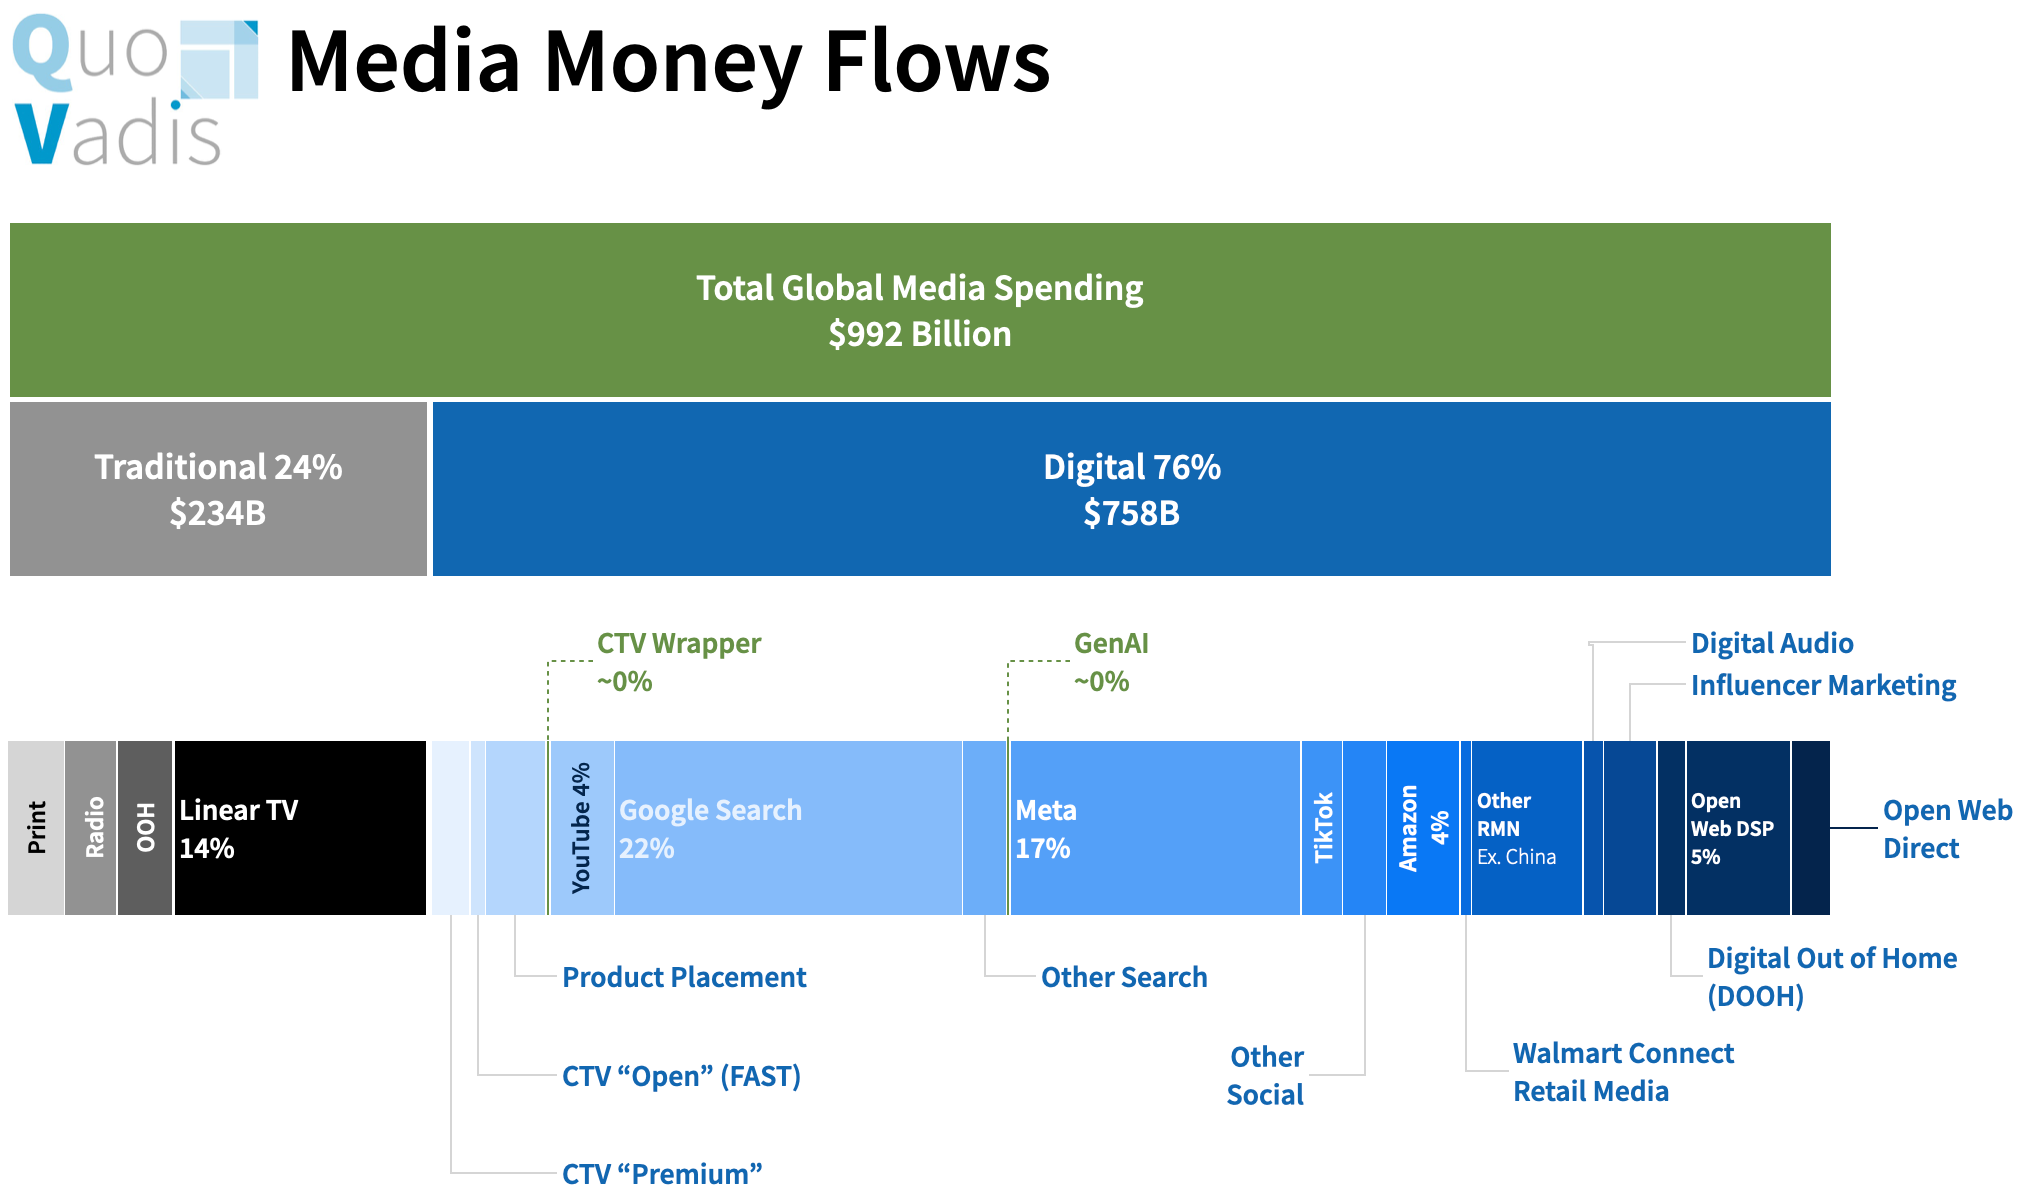
At the highest level of our chart, we estimate current global media spending at nearly $1 trillion, split 24% and 76% across traditional channels vs digital, respectively.
Traditional (24%)
As Brian Wieser, Ian Whitaker, and others routinely point out, Linear TV spending might be in decline, but it is also quite resilient and still viewed as a safe bet for many marketers. It also ranks as third in terms of market share at 14% and will likely remain there for quite some time.
Print, Radio, and Out of Home (OOH) are each around $30 billion globally, attracting 9% of advertiser wallets in total.
Print is declining in nominal dollar terms
Radio looks likely to remain flatish (perhaps a slight decline)
OOH is still growing around 5% per year
Digital (76%)
Let’s start with CTV. We split it into two buckets: “Premium" and "Open Internet FAST.” CTV Premium ad spend is around 2/3 of the total CTV market, but FAST is growing 2x faster. The premium stuff (Netflix, Amazon Prime, Hulu, Paramount, etc.) is bought on a direct, upfront basis and increasingly via programmatic tech. “Open Internet FAST” inventory is more likely to be bought via a DSP or other programmatic means.
Next up is Product Placement. To date, media spend on product placement has been about physically placing products in the production of content. For instance, when James Bond drives a BMW or a Jaguar and wears an Omega watch, or Emily in Paris can somehow afford a Hermès Birkin Bag, those are one-off product placements “hard-coded” into the content. A new emerging market of virtual product placement is taking shape within this $30 billion market, growing at a 12% CAGR since 2016. With CTV digitization and AI in-scene contextuality tech changing the game, it’s reasonable to foresee a dollar-for-dollar transition from physical to virtual product placement. The two most advanced players in the virtual space are Ryff and Rembrand.
Another up-and-coming category is CTV Wrappers. For instance, as you watch CTV content, you experience a 30-second “squeezeback” where the content squeezes back, making perimeter space for a brand to appear without interrupting the content experience. Another new format is an “enhanced ad break” with L-shaped calls to action surrounding the CTV video ad creative. This is an emerging space for green shoot companies like Olyzon that are poised to grow in tandem with eyeball migration to CTV.
We round out “TV” media money flows with YouTube. YouTube can be difficult to classify from a media channel perspective. On one hand, it competes with CTV for consumer attention. On the other hand, it also gets classified as a “social media” experience. For the avoidance of doubt, we place it squarely in the CTV bucket because it represents 12.8% of TV viewing according to Nielsen’s Gauge report. And its own, YouTube attracts more ad spend than CTV (Premium + FAST), capturing 4% of total global ad spend.
If we add together Linear TV + CTV + Product Placement + YouTube and simply call it “TV”, it captures 24% of all advertising spending and ranks #1 as a group.
Search is still the king of the digital jungle, attracting 22% of total global media flows. Google dominates search with a 90% share and is still growing about 10% per annum. Since 2019, Google search revenue has grown 15% on a CAGR basis and grew 11% YoY from 2Q24 to 2Q25.
GenAI ad placements are the topic du jour. Last week, a new OpenAI job listing indicated plans to build internal tools for campaign management, ad platform integration, and real-time attribution.
That’s a big signal for things to come. The more eyeballs shift to AI experiences, the more advertisers will need technology that leverages LLMs to deliver unique ad formats tailored to user experiences across thousands of GenAI applications (think of this as a new kind of publisher supply).
With everything in AI happening so fast, it’s difficult to market size this emerging ad space. But that does not stop us from giving it a go with Bass Model diffusion curve mapping using Google’s search revenue history as a template.
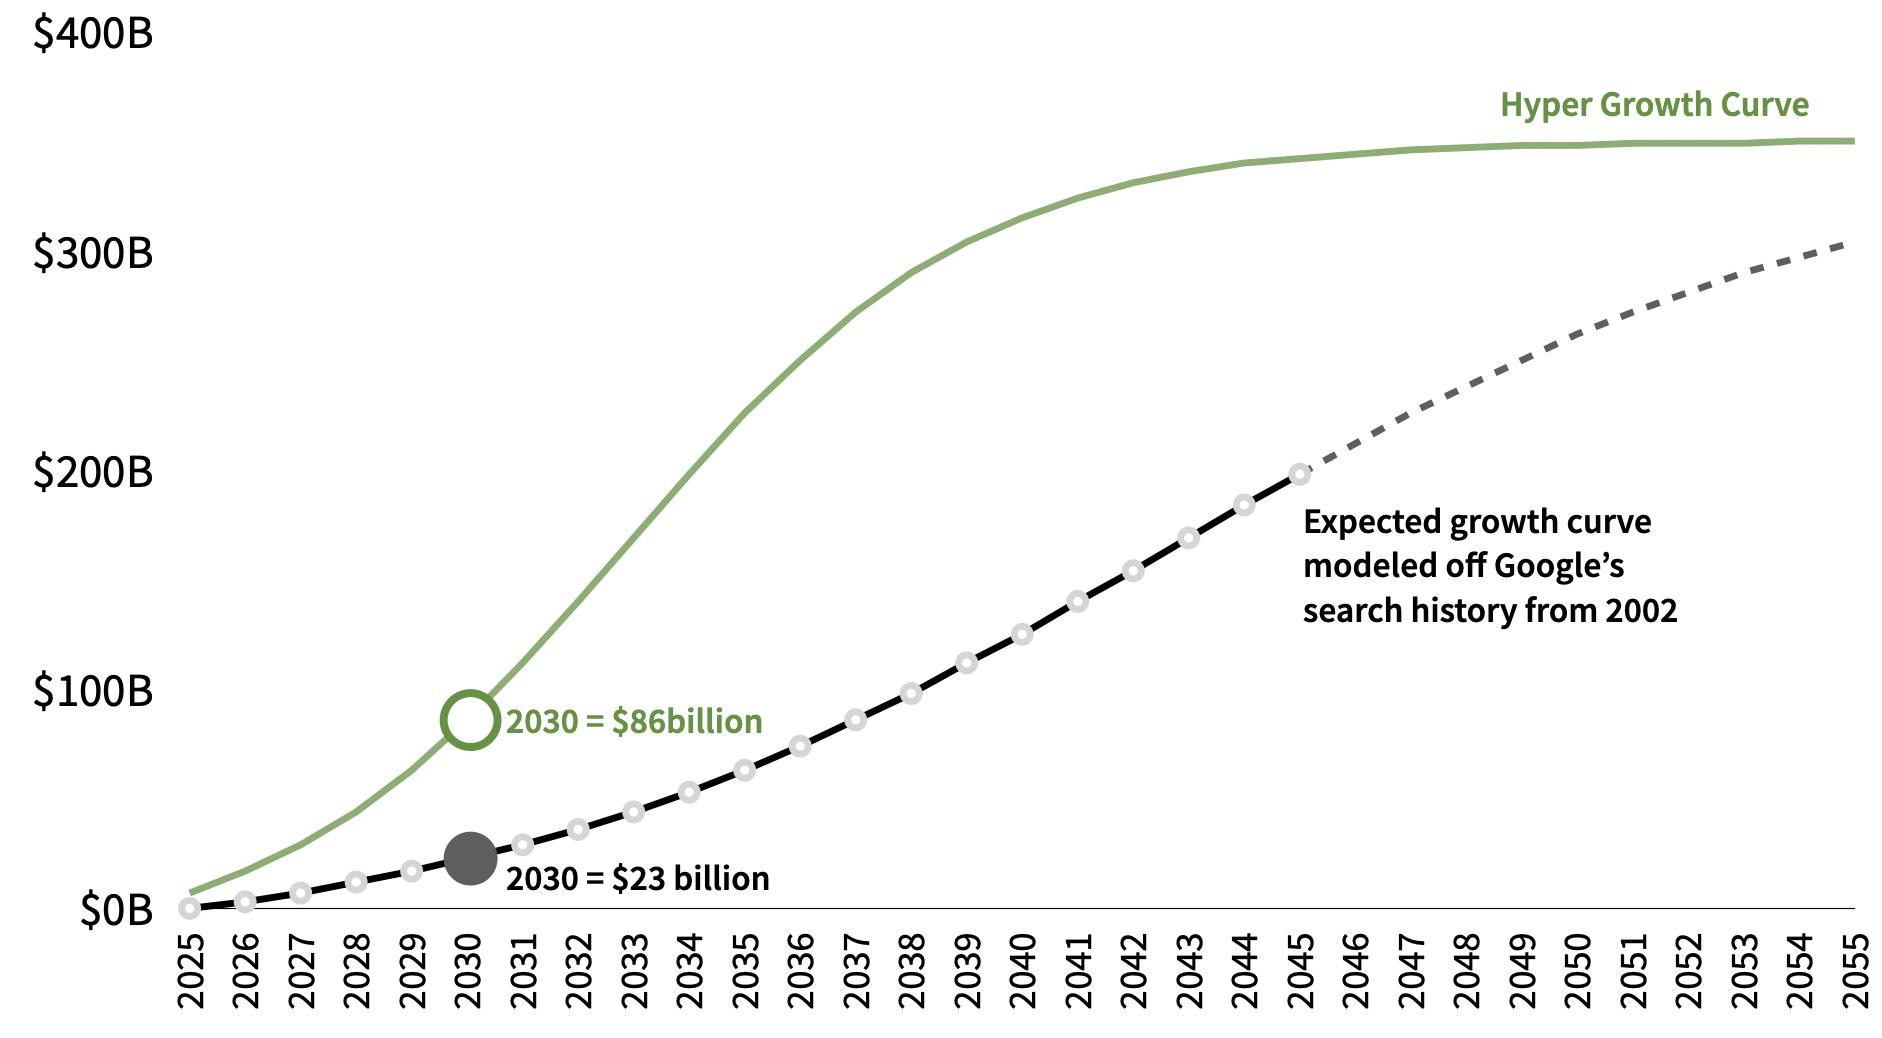
We start by leaning into Google’s historical growth curve starting in 2002, and set search market maturity in the future at $350 billion. Note that Google will generate roughly $210 billion in search revenue in 2025, and it’s still growing at a healthy pace. Google’s diffusion curve reveals three Bass Model parameter estimates:
Max market size in the future ($350B)
Coefficient (p) = ~0.02
Coefficient (q) = ~0.35
The GenAI ad market is essentially starting from near zero today. So, if history repeats on a similar curve, GenAI will be a $23 billion market by 2030 (the black line). Since technological innovation tends to compress time over time, it should not be surprising to see the GenAI ad market hit a hyper-growth curve, resulting in a much bigger market much sooner (the green line).
And if eyeball migration is any indication, OpenAI already has one billion users across an online population of 5.6 billion people (nearly 20% penetration).
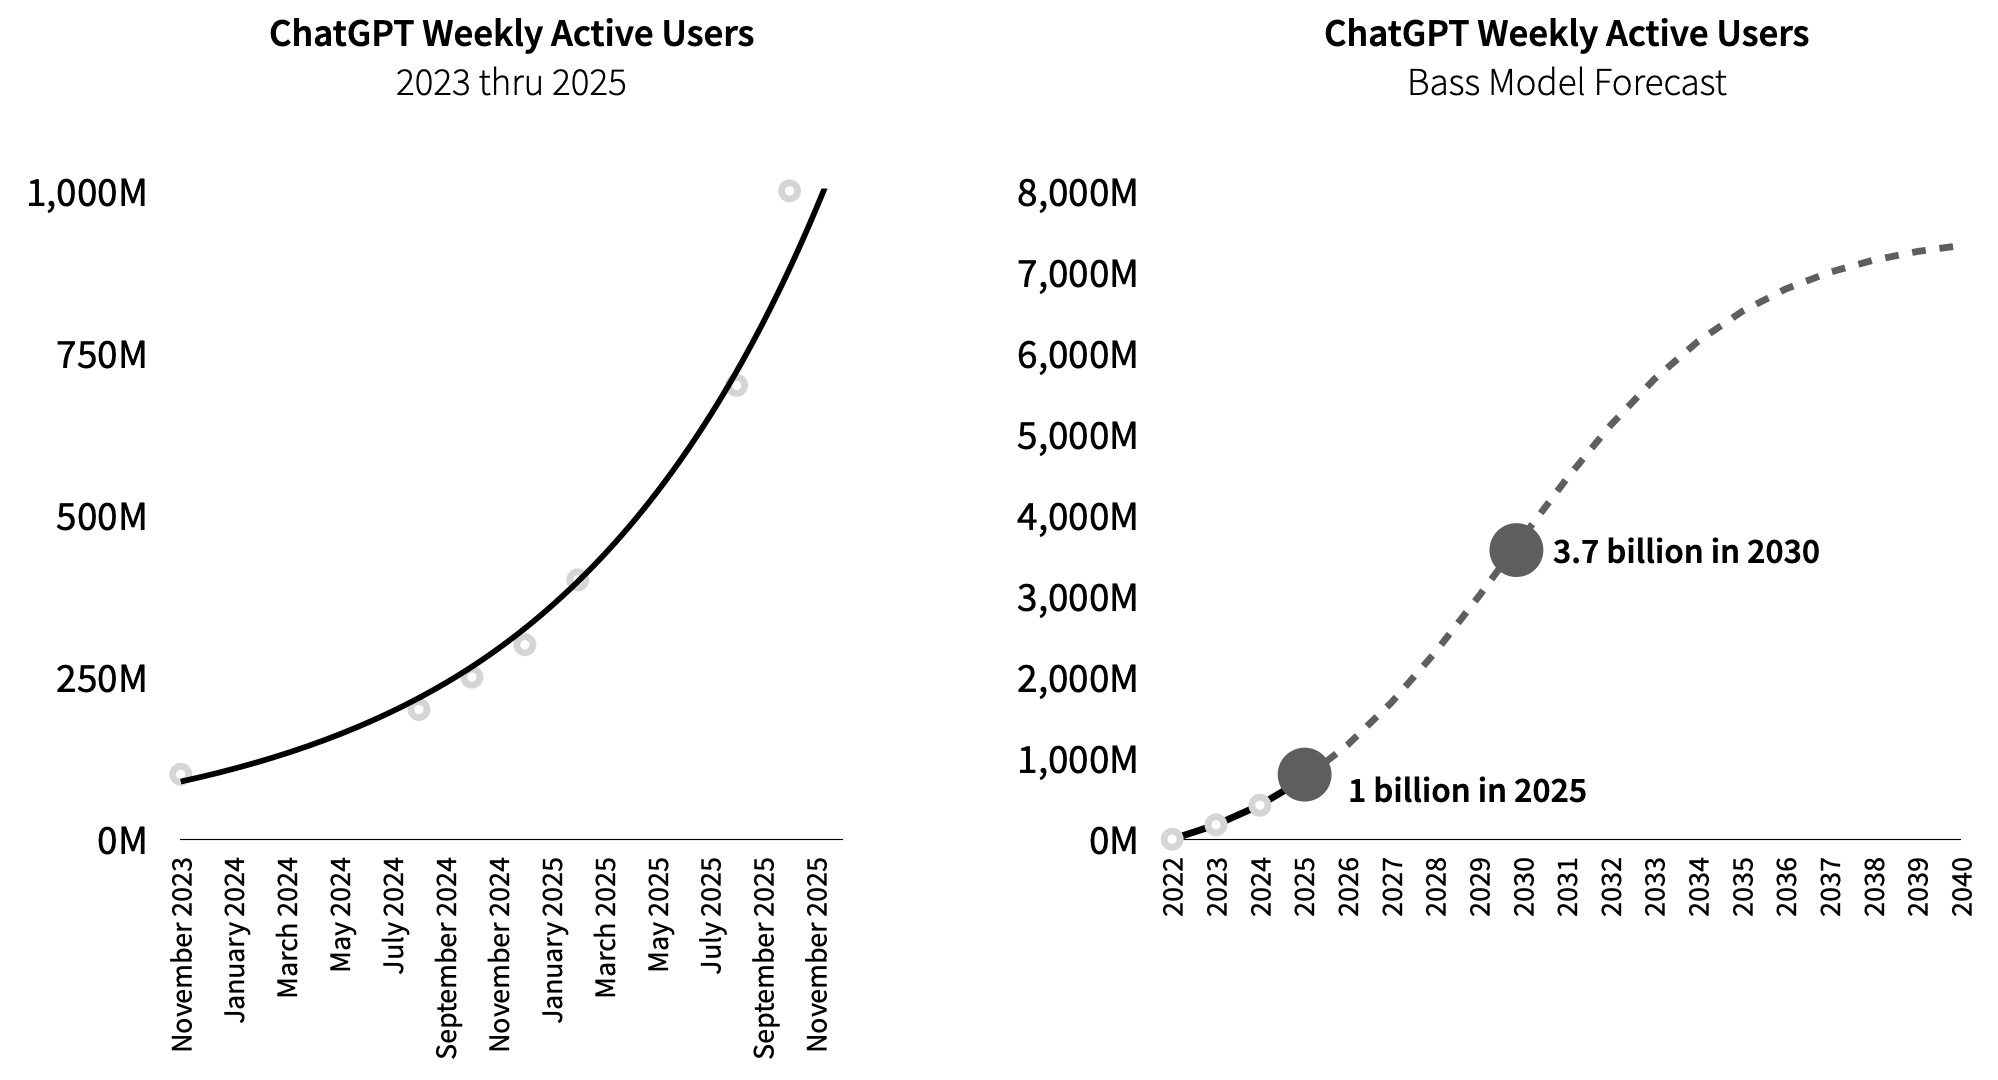
It’s going to be a massive market anyway you cut it. If we assume internet users grow to 7.5 billion by 2030 (e.g., near maturity) and if GenAI adoption holds to our comparative growth parameters, then there will be 3.7 billion users spending tons of time in AI experiences by 2030. Media money always follows eyeballs.
Social: Moving on to the social scene. Meta dominates across social with a 17% share of total media flows, and it’s still growing at a very healthy clip. We estimate Meta’s media dollar share will increase from 17% to ~23% over the next five years.
TikTok is the second biggest social player, attracting $23 billion of global media dollars. We estimate an 11% compounded annual growth rate (CAGR) over the next five years and a flat market share.
We bucket the remaining social players (Snap, LinkedIn, Pinterest, Reddit, etc.) into “Other Social.” WARC estimates the total social ad market at $247 billion (which includes YouTube). We subtract Meta, TikTok, and YouTube to estimate ~$24 billion in ad spending across other social platforms.
Influencer Marketing (Social) is $24 billion big and growing around 7% per year. We see this as a healthy space, particularly when huge advertisers like Unilever claim to spend half of their budget with creators and when Publicis, the biggest agency in the world, has invested $650 million by acquiring Influencial and Captiv8.
Notably, if we group Meta, TikTok, Other Social, and Influencer Marketing, the grouping adds up to a 24% share of global media flows.
Retail Media Warrants Its Own Section
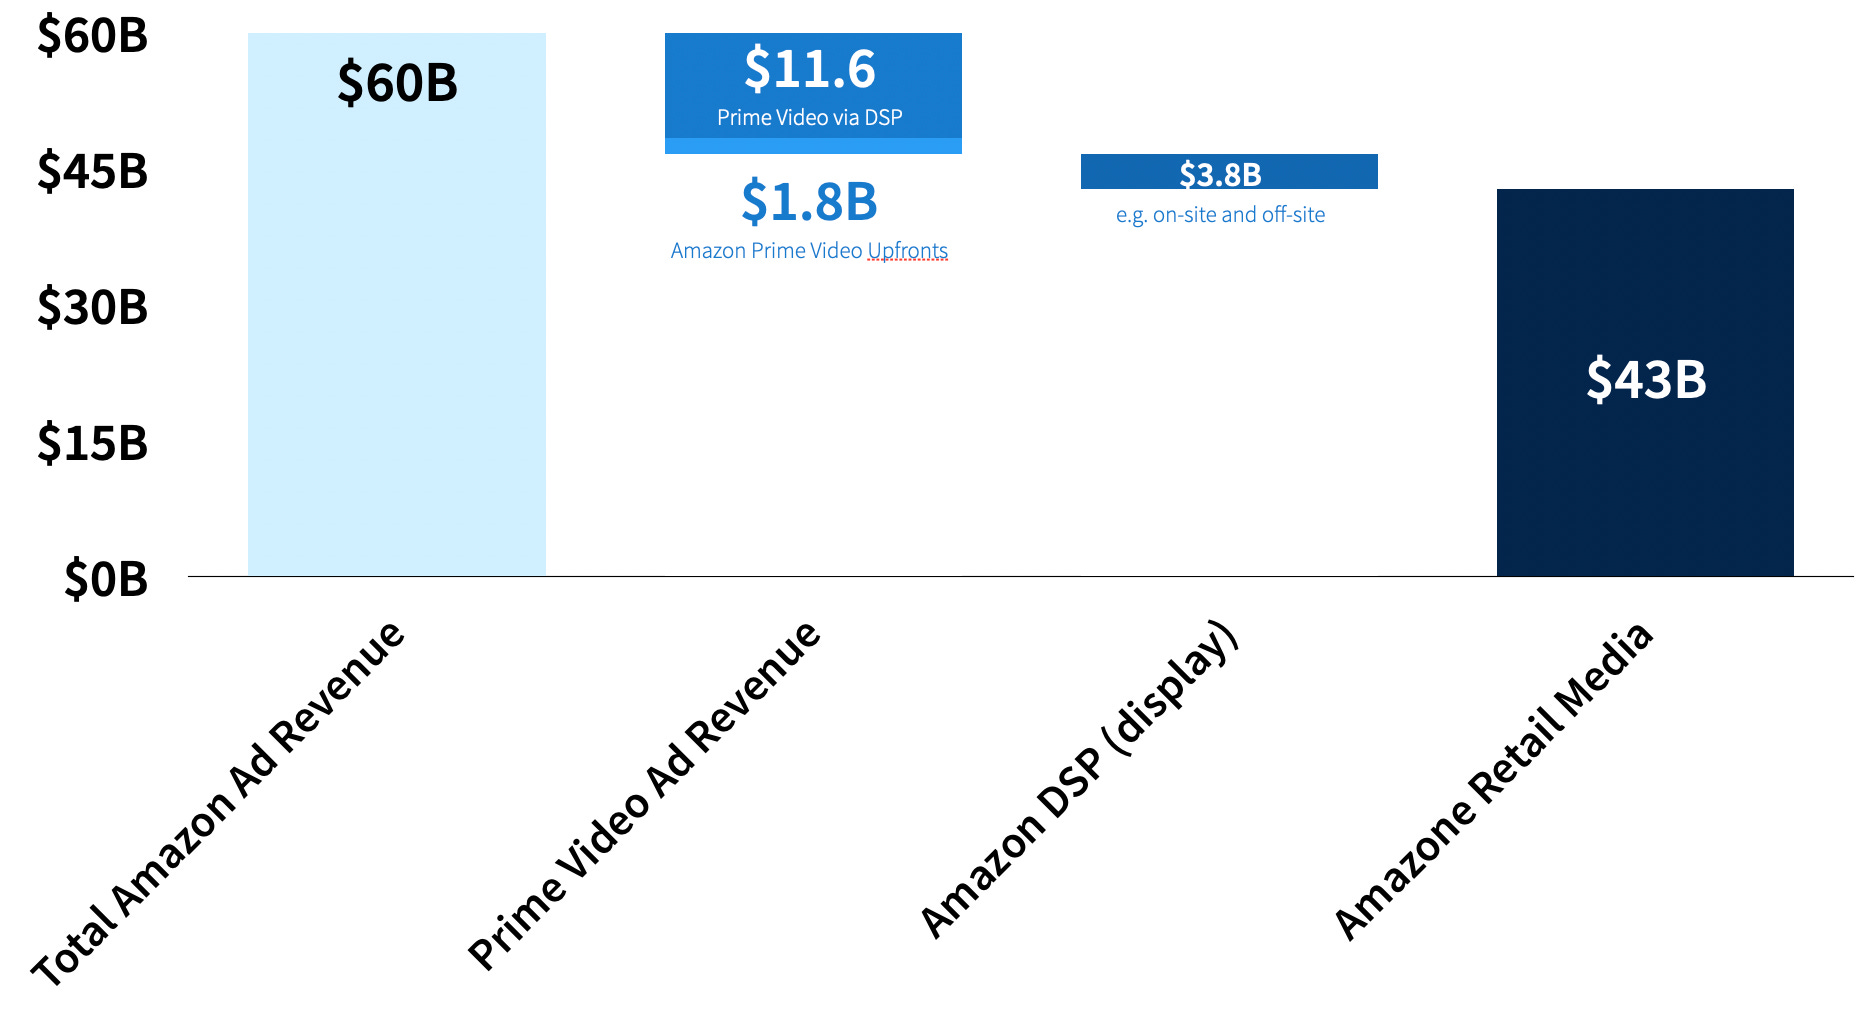
Amazon Retail Media (aka, “Advertising Services” in SEC filings) will process a whopping ~$60 billion in 2025 based on 2Q25 earnings. It’s not easy to disentangle the various ad streams within Amazon’s walls, but we’ll give it a shot.
We know from Nielsen’s Gauge report that Amazon Prime Video captures 3.9% of US streaming eyeballs, and we also know that US streaming is 47% of viewing (the rest is broadcast, cable TV, etc.). If we carve out streaming, Amazon Prime has a ~8% share (3.9% / 47% = ~8%).
We know from above that Premium + FAST + YouTube ad spend is $77 billion globally, so Amazon Prime’s US ad revenue is roughly $6.5 billion. Estimates indicate that 49% of Amazon Prime viewers are in the US, so our best guess of Prime Video’s global ad revenue is ~$13.7 billion.
According to one source, Prime Video sells around $1.8 billion in the UpFronts, leaving $11.5 billion, which is likely sold via Amazon’s DSP.
But Amazon sells display ads via its DSP too. How much? Let’s take a whack and see if we land in a reasonable zone.
As you’ll see below, when we cover Open Web DSPs, we estimate $45 billion of media dollars flow through all DSPs, excluding Amazon DSP.
We know Amazon’s 10K/10Q total ad revenue is $60 billion.
We have an estimate for total global retail media spending at $100 billion (see below)
And we have a good estimate for CTV spending (Premium and FAST) at $29 billion.
Now we can invoke some basic proportional algebra to solve Amazon DSP revenues.
Therefore:
And:
Leaving is with:
After we subtract the $11.5 billion in Prime Video going through the DSP, we get $3.8 billion for Amazon's “Open Web” DSP ad spend.
With a decent estimate in hand, we back into Amazon’s retail media ad revenues at $43 billion.
Walmart Connect Retail Media: With $4.4 billion in gross ad spend last year and $5.3 billion expected this year, Walmart Connect Retail Media is a big enough player to include as an independent media channel. We estimate a 10% average growth rate over the next five years to maintain its current share of the media pie.
That leaves a large bucket for “Other Retail Media” consisting of hundreds of retail media networks around the world. eMarketer estimates that global retail media in 2024 was $140 billion, but that includes ad spend in China on Alibaba, JC.com, Meituan, etc. We remove spending in China using proportional GDP (US = 26%, China = 17%) relative to global ad spend (US = 45% billion, China = 30%), resulting in ~$40 billion of retail media activity happening in China.
After subtracting Amazon ($43B) and Walmart ($5.3B), that leaves a whopping $52 billion for our “Other Retail Media” bucket spread across hundreds of retail media players growing around 13% per year over the next five years.
Assuming an 80/20 rule across 250 RMNs according to Digital reporting, the top 20% bigger players process nearly $1 billion each, and the long tail averages $51 million for each RMN.
The Remaining Channels
Audio is the digital sibling of Radio, taking in $10 billion in media flows. We estimate 15% average annual growth over the next five years.
Digital Out of Home (DOOH) is the digital sibling of OOH. The total OOH market (traditional and digital) is $46 billion, with Digital OOH making up 34% or $16 billion.
Open Web DSP and Open Web Direct: Last but not least, we come to media flows on open web display ads (mostly banners, in- and out-stream video, and some CTV). Altogether, it’s a giant $66 billion market with 73% or $48 billion moving through DSPs.
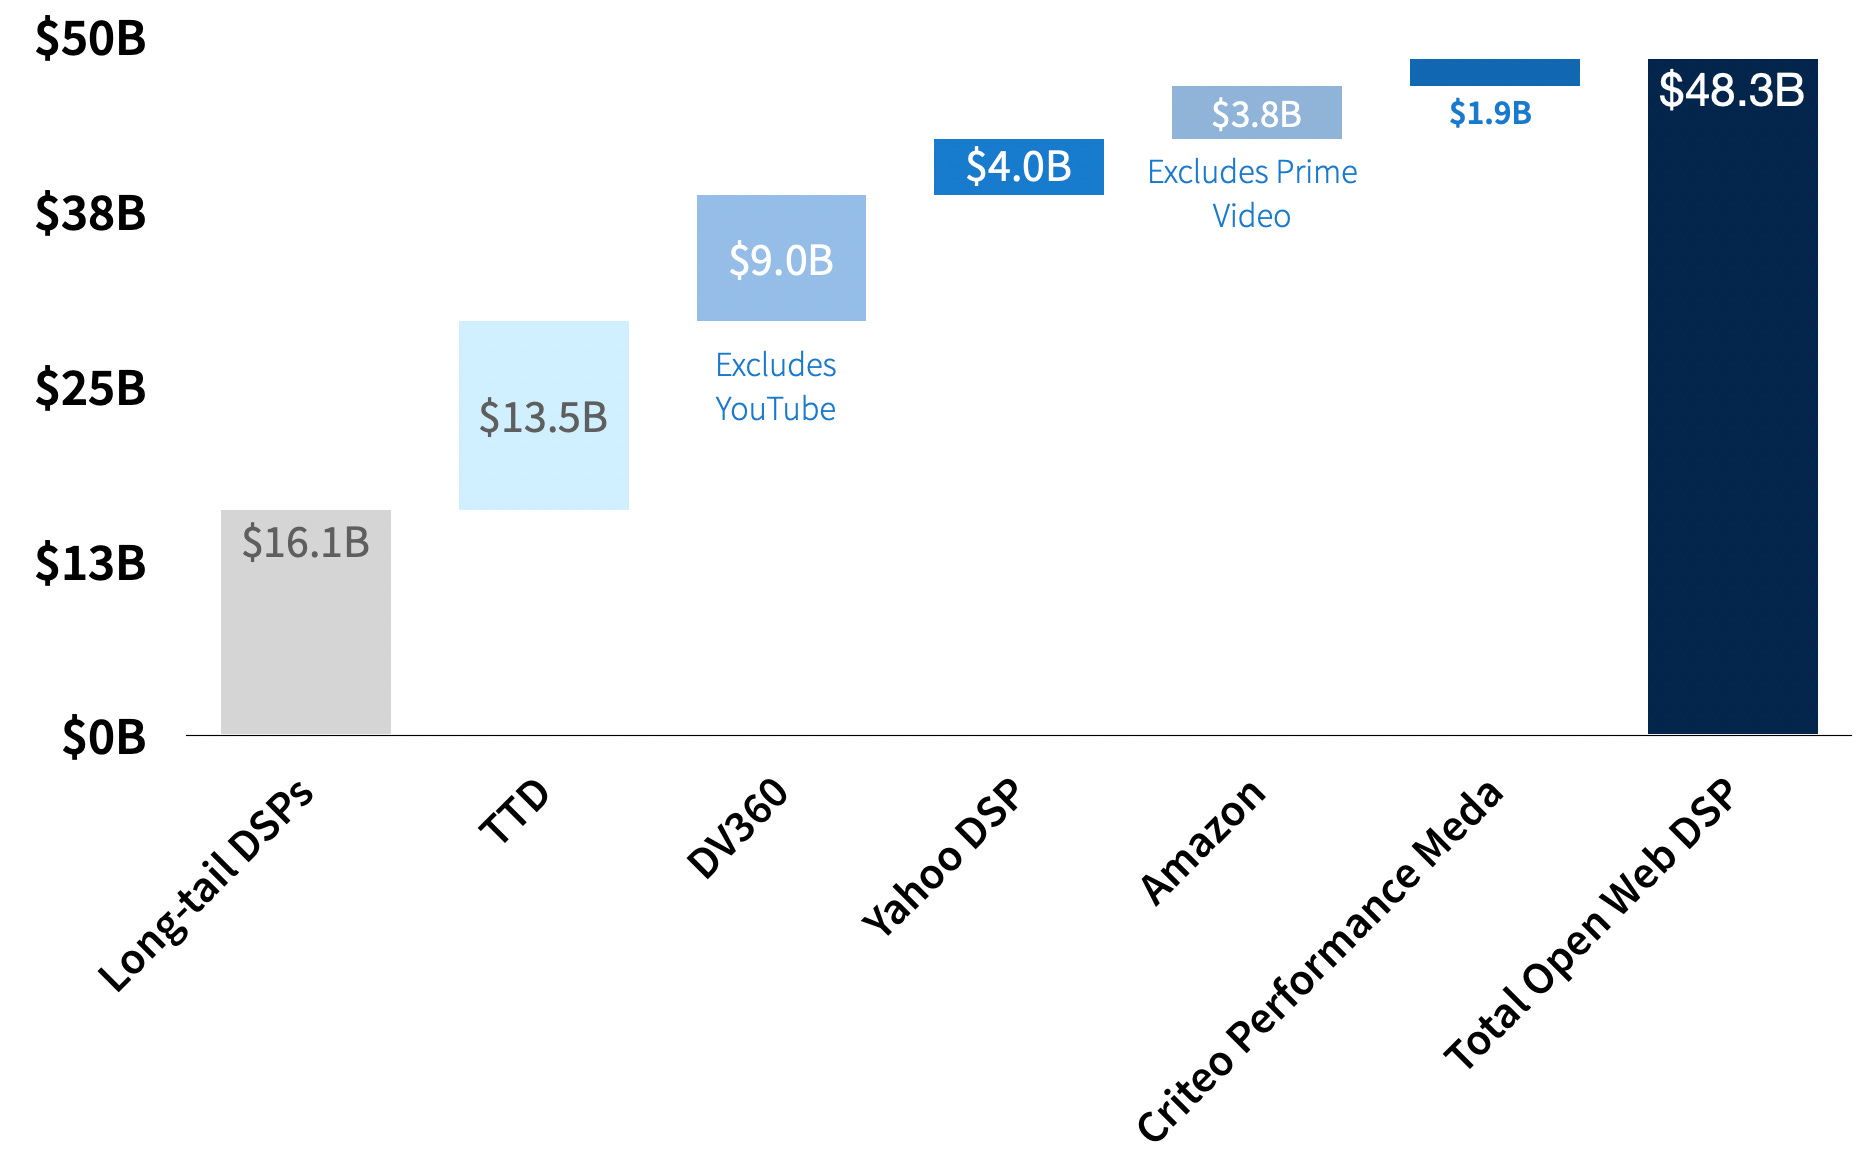
Open Web DSP Stack:
Start with a long tail of 47 small and medium-sized DSPs with less than $1 billion in gross ad spending. Average gross ad spend across our DSP long-tail is $355 million. Median gross ad spend is around $200 million.
The Trade Desk will process around $13.5 billion in gross ad spend this year.
New news came in last week from the Google adtech trial, revealing $9 billion in gross ad spend on DV360 (excluding YouTube). If we include YouTube, the estimate doubles to $18 billion for DV360.
Based on our Yahoo valuation work from two years ago, we estimate around $4 billion for Yahoo’s growing DSP.
As noted above, we estimate Amazon’s DSP processes around $3.8 billion in gross ad spend (excludes Prime Video). If we included Prime Video, Amazon’s DSP processes $15.5 billion (bigger than TTD).
Criteo’s DSP processes $1.9 billion across its Performance Marketing business and another ~$2.4 billion across its Retail Media Business (already included above in Other Retail Media).
Competition Galore
“Competition Galore” is a phrase used to describe a period or event with many competitions happening at once. If our imperfect exercise illustrates anything, it is that advertising is the poster child of competition from the perspective of all the many choices advertisers have at their disposal.
Disclaimer: This post, and any other post from Quo Vadis, should not be considered investment advice. This content is for informational purposes only. You should not construe this information, or any other material from Quo Vadis, as investment, financial, or any other form of advice.
Fantastic piece of work. Straight to the point, cutting through the self-interested BS coming from all sides.