
#135: Measuring Marginal Media Value
Last Media Dollar Live in London December 9; Findings from the Last Media Dollar Game; The Future of TV revealed through preferences.
Last Media Dollar “Live” in London is on December 9 at Everyman Theatre in Borough Market. If you’re based in London/UK or happen to be in town on December 9, Quo Vadis is hosting our first LMD Live event. Get one of our remaining tickets today and experience it yourself. Use discount code LMD25 for a £75 ticket.
Dec 10 at 10:00 AM: Join Quo Vadis and CWire’s CEO, Rui de Freitas, for a live conversation on how collaborative persona creation, contextual AI, and transparent supply signals are paving the way for autonomous planning and buying agents. We’ll unpack how to turn static personas into shared, machine-readable objects that drive real activation today and lay the foundation for fully autonomous media-buying systems. Registration here.
Measuring Marginal Media Value
For the past few months, we have been running the Last Media Dollar (LMD) game experiment with real marketers and media practitioners. The game is simple:
There are 22 places where most media money flows (See Updated Media Money Flows, October 2025).
You’re down to your last media dollar and must choose between two channels in pure head-to-head matchups.
No budgets. No politics. No gaslighting. No attribution dashboards that create bias in your head. Instead, you get loss aversion in motion and gut instinct as if Tversky/Kahneman were framing the trade-offs for you to make.
Methodology: Across nearly 200 game sessions and over 14,000 1-to-1 matches, we collected real decisions and converted them into win rates. The win rates are then simulated into the 231 matches it would take for all 22 media channels to play each other one time. That would take too long to play, so we designed LMD to be played in ~10 minutes, where between 60 and 110 matches are played. That gives us reliable win rate statistics. For example, if YouTube has a 72% win rate from our sample data set and Linear TV has a 49% win rate, then YouTube beats Linear TV in the backend simulation.
Finally, we fed the simulated results into a Bradley–Terry model to extract a clean “preference strength” for each channel. In parallel, we line up the actual market shares (where the money actually goes today, see Updated Media Money Flows, October 2025) and compare them to the preference rankings (where people would want the money to go if freed from the system’s frictions).
This creates a rare kind of map between the psychological market versus the media market. It’s the difference between a frictionless market and one structured on all kinds of incentives that can diminish advertising outcomes in favor of financial outcomes.
Market Frictions Between Preferences and Actuals
The Last Media Dollar is a designed experiment to reveal true preference, but the media economy isn’t built to follow preference. Between structural constraints, organizational incentives, and legacy systems, an entire stack of market frictions sits between what marketers want to do and what the industry actually does. In classic economic terms, LMD attempts to reveal an efficient market signal of true marginal value, while today’s media budgets reflect an inefficient market distorted by frictions, incentives, and legacy structures.
This isn’t unusual. Most real-world markets drift toward inefficiency whenever the following ten habits accumulate faster than the ability to reallocate capital decisions like media spending:
1. Budget silos: Even if a marketer prefers a channel, the silo walls prevent money from moving across categories.
2. Procurement & contracting inertia: Long-term upfront commitments (especially in Linear TV) lock in spend regardless of marginal preference.
3. Measurement systems anchored in the past: Channels with weaker or newer measurement frameworks can’t “win” on reports even if they win in preference.
4. Organizational politics & incentives: Teams optimize for internal scorecards, not economic truth, while agencies favor channels tied to rebates and favorable margin structures. Everyone deserves to make a buck in the media trade.
5. Ease-of-execution (friction costs): Channels like Search, Meta, and YouTube are very easy to buy and optimize at scale.
6. Legacy planning frameworks: Annual planning cycles allocate to TV first because “that’s how planning is done,” while newer channels only get incremental dollars.
7. Risk aversion & CYA behavior: No CMO gets fired for putting money into Google, Meta, or Amazon, even though all three of the big players get CMOs stuck in a game called escalation of commitment.
8. Reporting ecosystems built around the big platforms: What gets measured gets spent. Dashboards are built around Google Ads, Meta Ads Manager, and TV GRPs.
9. HoldCo trade economy: Agencies are financially incentivized to maintain spend in specific channels, regardless of marketer preference. Preferred channels at the marketer level often lose inside agency trading systems.
10. Complexity penalties: Simplicity wins budgets for now, but dealing with complexity with agentic AI will very likely win the future and perhaps align preferences to more efficient media spending allocations.
What We Found: Preference ≠ Spend
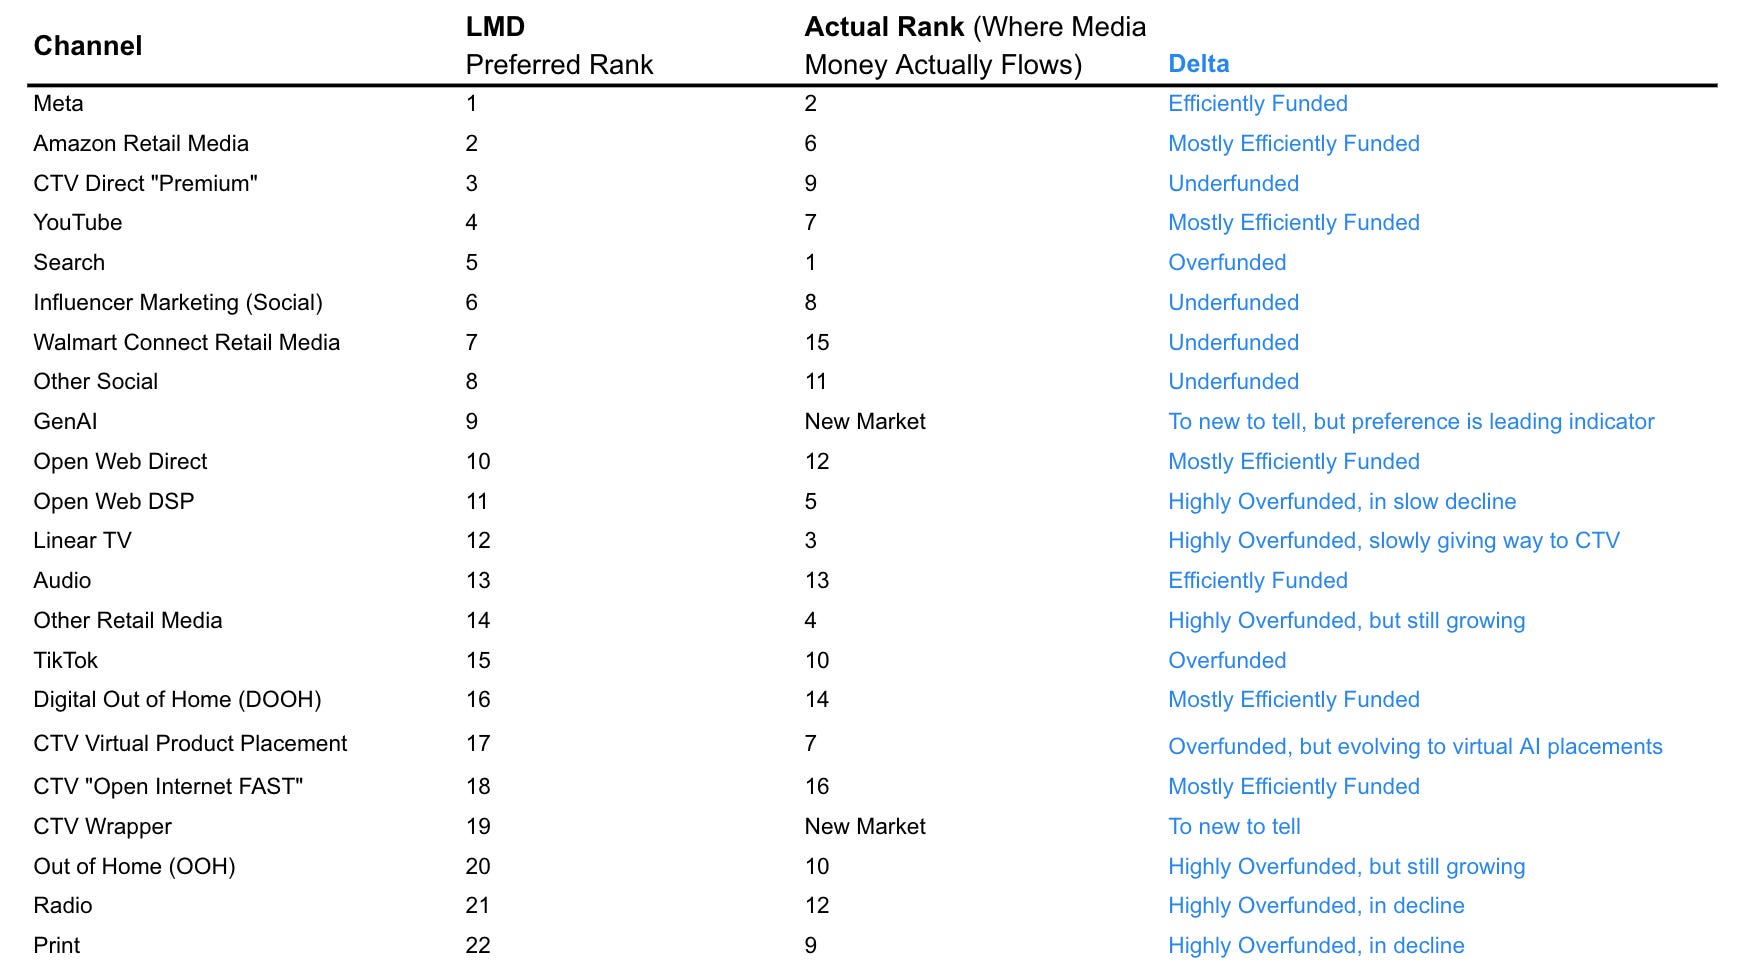
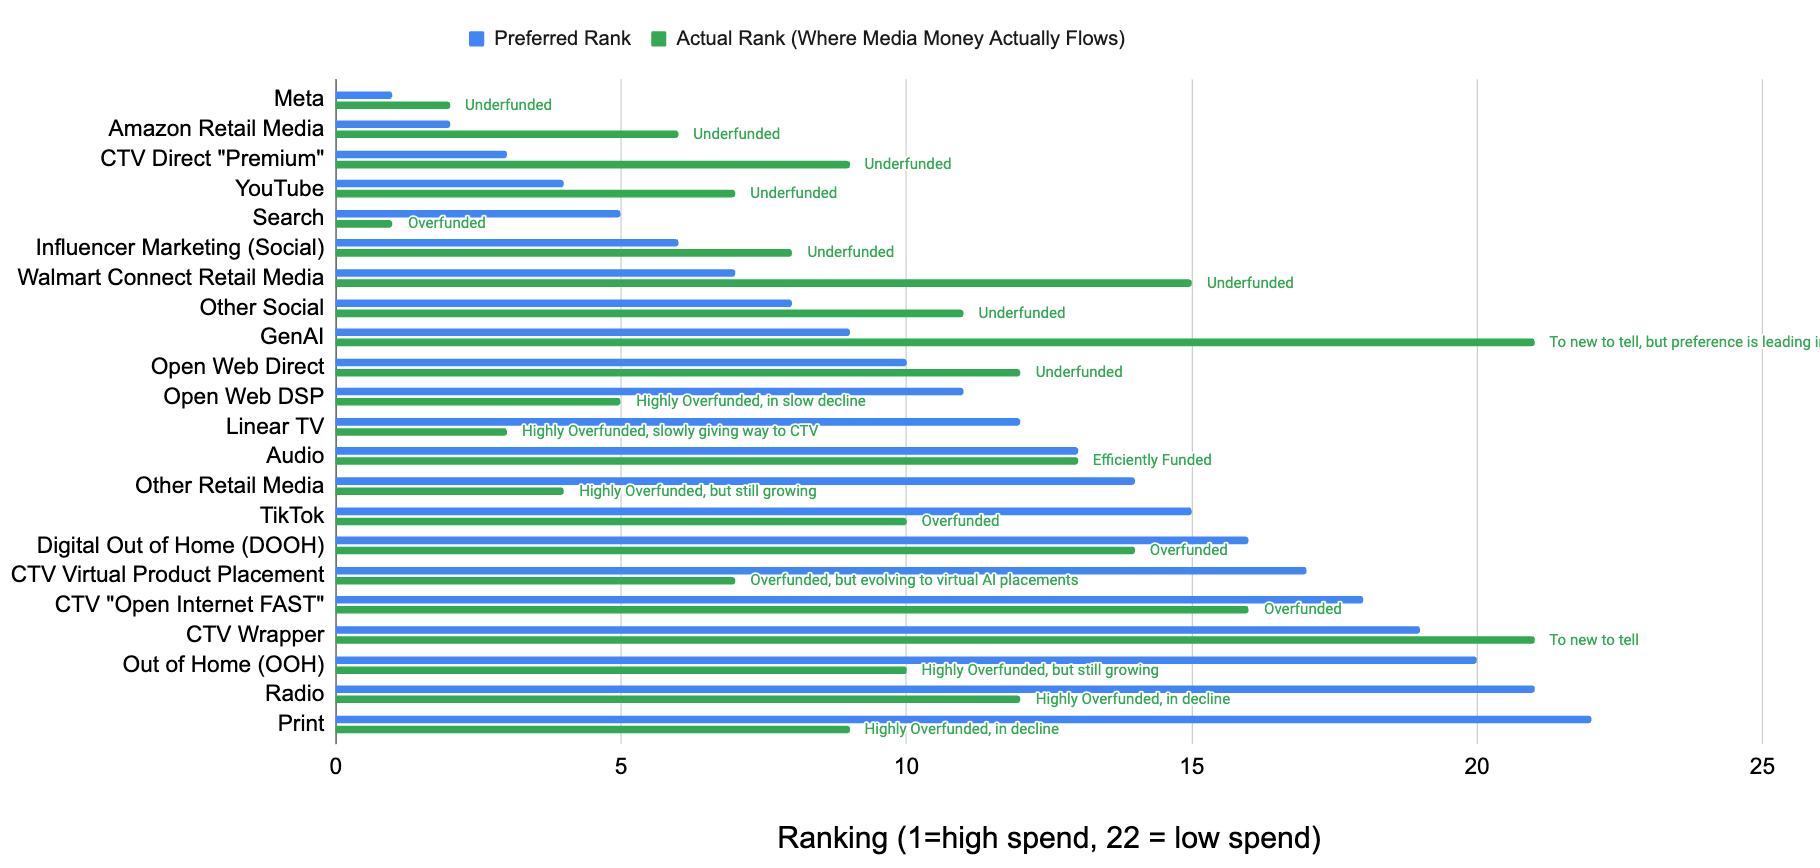
Let’s start with the broad strokes. The preference-vs-actual ranking reveals a far more nuanced Big Tech story than the broad “platforms dominate regardless of value” narrative.
Meta and YouTube are remarkably close to equilibrium, with their actual market shares closely matching what game players choose in forced trade-off scenarios, making them the most efficiently funded channels in the ecosystem.
Amazon Retail Media shows only moderate underfunding, suggesting structural constraints rather than a lack of belief. It seems clear that marketers want to allocate more to Amazon. That’s why we have Amazon's ad revenue growing at a 15% CAGR over the next five years.
The lone outlier is Search, which is significantly overfunded relative to preference. However, advertising in GenAI environments is in the top half of preference ranking as the “new search advertising space.”
Retail, Social, and CTV channels show latent upward pressure. Amazon Retail Media, Walmart Connect, Influencer Marketing, and CTV Direct Premium all scored significantly higher in preference than in actual budget ranking. This tells us something important:
These channels are “where marketers want to go,” but the machine hasn’t let them get there yet.
The TV story is a tectonic imbalance
TV deserves its own section because the magnitude is stunning. Across all matchups, preferences, and Bradley–Terry scoring, we can see that Linear TV has a low preference rank (12) but very high actual spending rank (3). In other words, Linear TV is 3.5x overfunded relative to preference, but CTV is 3.6x underfunded relative to preference.
It’s a mirror image illustrating the tectonic imbalance between what marketers believe in a pure decision moment and what their systems allow them to do today. Linear TV persists because the current machinery of media planning was built around it. However, CTV is gradually accelerating as eyeballs shift because the marginal dollar righty believes in a TV future with context and audience targeting at its core.
Brian O’Kelley Thought Experiment: Imagine a world where buyer and seller agents simply match themselves based on mutual preference, letting the market discover its own equilibrium. In that world, the sytem’s belief system gets aligned to outcomes. (See A Matching Algorithm for an AdCP Stable Market). That’s the future of TV. It’s about a structural overhang yielding to the behavioral momentum of where the market wants to move before the dollars actually move.
What It Means, Especially on December 9
On December 9, there are two great events in London. One is “The Future of TV,” an all-day conference with nine themes and ~20 speakers offering industry reflection.
The other great event is an experiment called Last Media Dollar Live at Everyman Theatre in Borough Market. LMD Live is a boutique, behavioral-economics-driven experience. We aren’t debating the future of TV because our preference data and layman observations already show us the way. You’ll get to see how Cadi Jones (SVP EMEA, Index Exchange), Dan Plant (Chief Strategy Officer, Starcom), and Richard Kramer (Managing Director/Founder at Arete Research) make and rationalize their media choices live on stage.
As far as the future of TV goes, it’s already answered. CTV wins by preference while Linear TV wins by structural inertia. The only question is:
For how long will Linear TV inertia hold?
🎟️  Get one of our remaining tickets today and experience it yourself.
🎟️ Use discount code LMD25 for a £75 ticket.
🎟️ That's a lot of bang for the buck!

Disclaimer: This post, and any other post from Quo Vadis, should not be considered investment advice. This content is for informational purposes only. You should not construe this information, or any other material from Quo Vadis, as investment, financial, or any other form of advice.