
#142: 4Q25 and FY25 AdTech, MarTech, Agency Update
Equal-dollar portfolio update with trends; A word on betas.
The countdown begins! Advertising Economic Forum Returns to New York City: March 18–19, 2026. Day 1 at Horizon Media, from 12:30 PM to 6:00 PM, features eight very impressive AI founders pitching to our esteemed investor panel across agentic commerce, creative, and emerging agency models. Our full-day “Davos” format on Day 2 at The New York Times Center convenes 400 senior leaders for closed-door sessions examining market structure, incentives, and the economic forces reshaping advertising today. Secure your spot to soak in the most unique content and the most enlightened networking buzz.
4Q25 and FY25 AdTech, MarTech, Agency Update
With 4Q25 and full-year 2025 earnings now reported (except RAMP, fiscal year ending March 31), we can assess how our equal-weighted portfolios have performed since our Q3 update in November.
As a reminder, each portfolio starts with a $100 investment divided equally across all constituent stocks. If a company exits public life (e.g., IAS) or a relevant company goes public (e.g., MNTN), we remove or add it and rebalance on an equal-dollar basis.
Here’s how it works using our AdTech11 portfolio as an example. You start with $100, divide it equally across 11 companies, and buy shares in each based on the stock price on January 1, 2022. If things go well, you find alpha by beating the NASDAQ or S&P500.
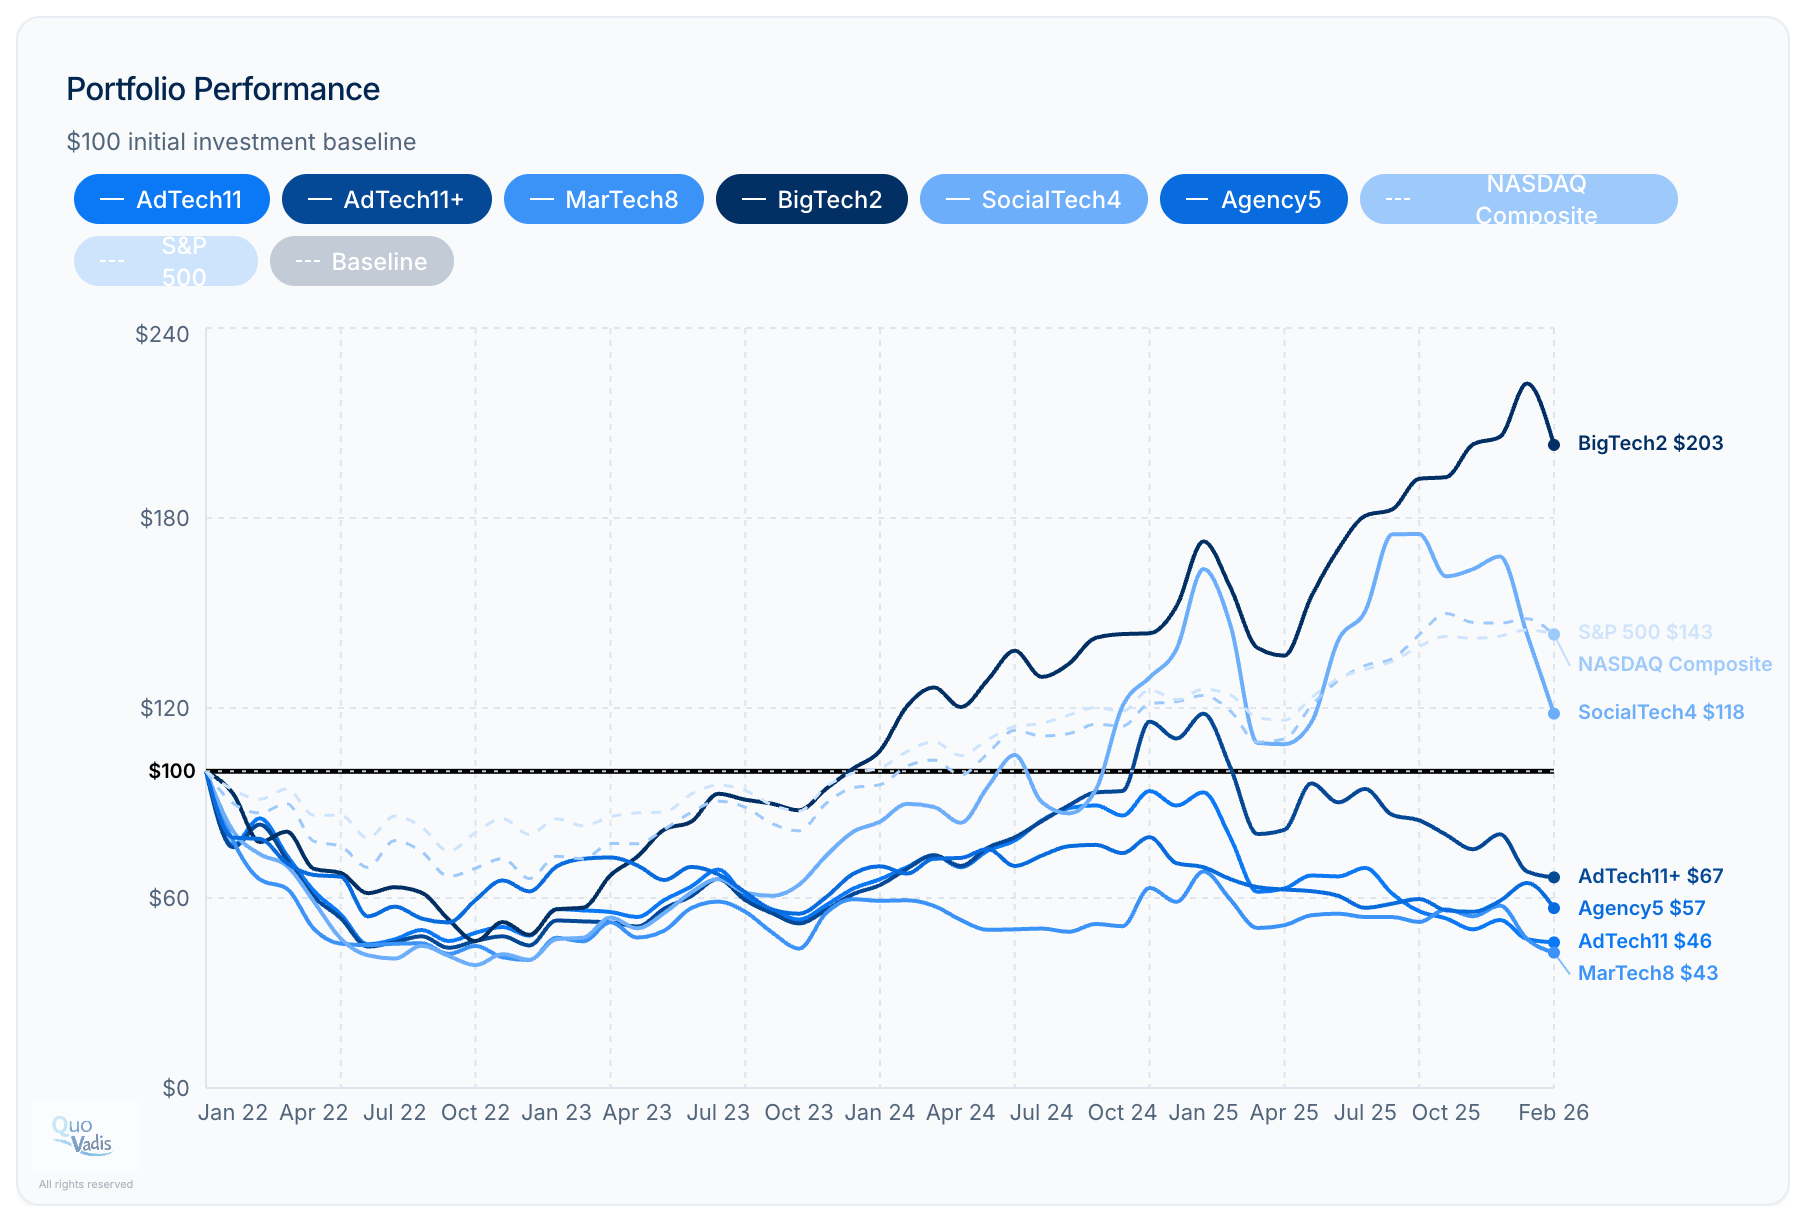
Key Benchmarks: The NASDAQ and S&P 500 are both up ↑43% since January 2022. We also include our BigTech2 (Google and Meta) to benchmark what top “durable moat” performance looks like for companies with incredibly deep and defensible economic spreads.
What is a moat? Quo Vadis defines a “moat” as the spread between a company’s return on operating invested capital (ROIC) and its cost of capital (aka, economic spread). In other words, the criteria for success is the economic spread and the measure of success is ROIC > Cost of Capital.
For Google and Meta, that all-important spread is 30% or more, depending on the quarter. With top quartile spreads, both companies are happy to make giant investments in new invested capital to sustain their moat in the AI age. In our Portfolio Chart chart above, investors are basically saying, “Earnings talk is cheap. Get a sustainable moat or we’ll penalize you.”
AdTech11
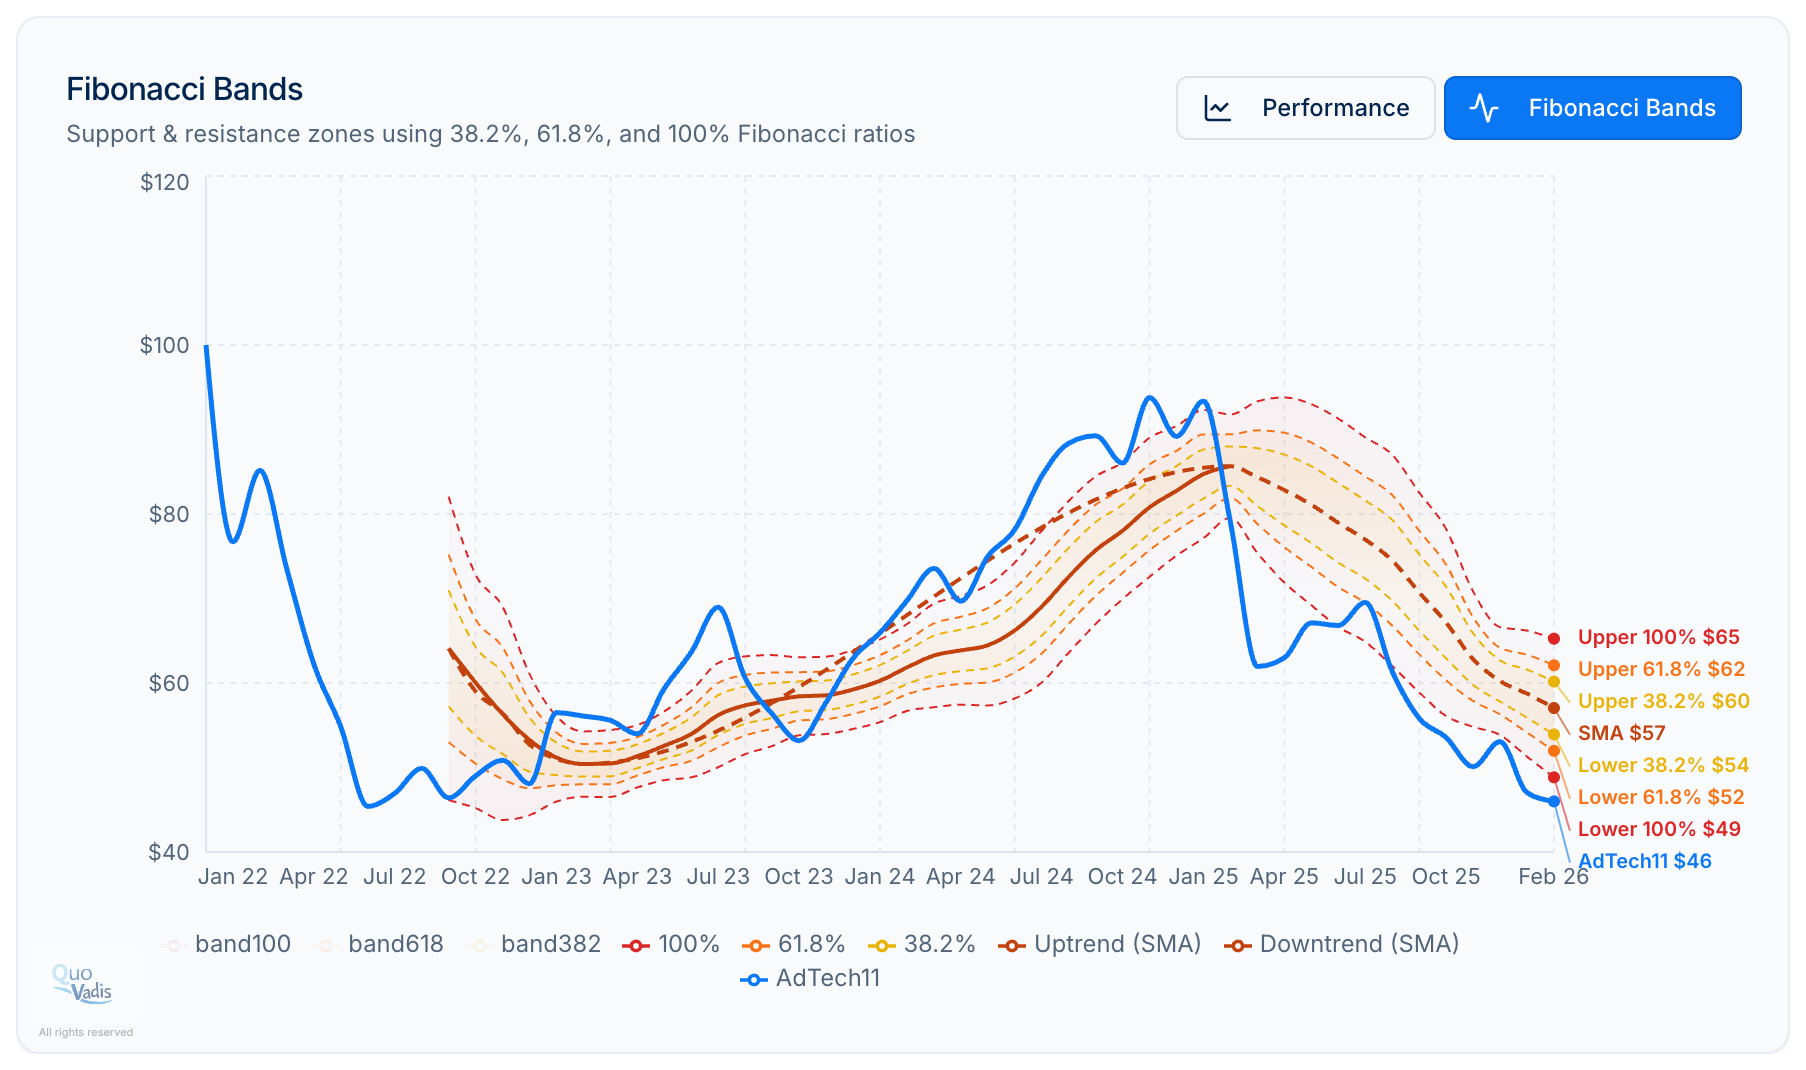
Our AdTech11 portfolio is ↓54% since inception. Note that IAS was taken private by Novacap for $1.9 billion and removed from the portfolio in January 2026. MNTN was added in June 2025 following its IPO, currently trading at a $720 million market capitalization and $510 million enterprise value. Following its IPO in May 2025, the “CTV” company had a market capitalization of over $2 billion.
Overall, AdTech11 was trending upward toward the end of last year but has since reversed course and is now trending downward. In other words, the same $100 invested in a NASDAQ ETF would have returned 43% with less risk.
Gainers: ZETA (+96%) and DSP (+1%).
Downers: MGNI (-24%), RAMP (-46%), CRTO (-54%), TBLA (-59%), MNTN (-63%), DV (-68%), TTD (-74%), PUBM (-76%), and TEAD (-94%).
AdTech11+ (with AppLovin)
When we include AppLovin (APP) in the mix, our AdTech11+ portfolio is only ↓33%. APP alone is up ↑361%, single-handedly carrying the portfolio.
MarTech8
Our MarTech8 portfolio remains deeply in the red, ↓57%. The portfolio includes SHOP, HUBS, SPT, SEMR, TWLO, BRZE, YEXT, and AMPL. It turns out that SaaS revenue models are not superior to media percentage models for generating cash flow.
Shopify (-11%) used to dominate our MarTech portfolio and contribute to nearly all the gains. From our perspective, this shows how disruptive AI has become in investors' minds, particularly when they consider SaaS-based businesses.
BigTech2
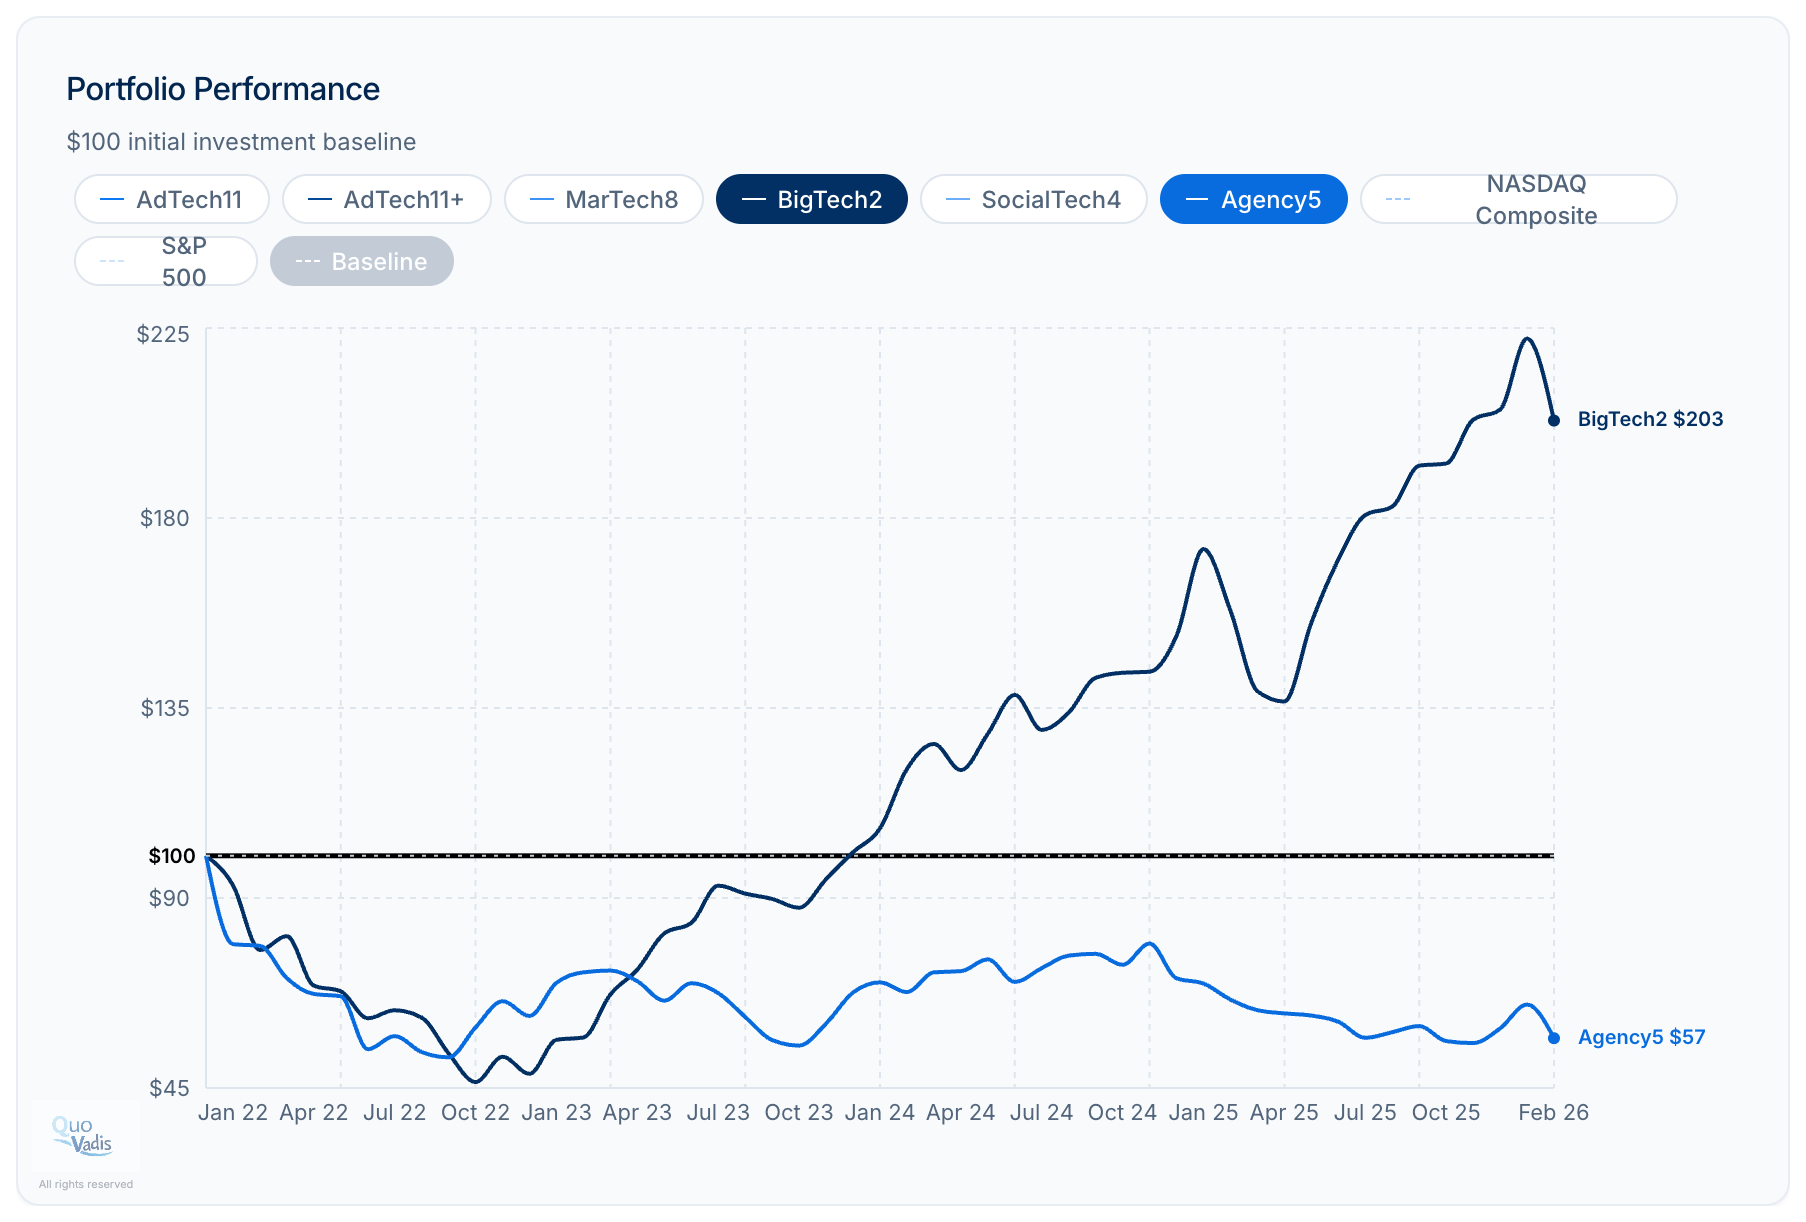
We track two Big Tech ad players, Google (GOOG) and Meta (META). Had you invested $100 on a 50/50 basis in January 2022, you’d be ↑103% GOOG (+115%) and META (+91%), respectively.
Between the two companies, they controlled 40% of global ad spending in 2025. Given reasonable growth expectations, we estimate their combined share will increase to 46% by 2030.
SocialTech4
Our SocialTech4 portfolio is ↑18%. The portfolio includes META, SNAP, PINS, and RDDT. Reddit (RDDT) was added in April 2024 following its IPO. Reddit is the biggest winner, up 217% since entering the portfolio.
Meanwhile, Pinterest made news last quarter with its acquisition of TVScientific. The company reported a bullish outlook for the first quarter, citing the impact of expanding its connected-TV capabilities within its Performance+ AI optimization portfolio.
Agency5
Our agency portfolio consists of WPP, Publicis, Omnicom, Stagwell, and S4 Capital (SFOR.L). Note that IPG was removed following its acquisition by Omnicom, making the combined agency the largest in the world and displacing Publicis (for now).
The Agency5 portfolio is down ↓43% since inception. Publicis and Omnicom are the only agencies in the black, up 33% and 15%, respectively.
They say a picture is worth a thousand words. We don’t need a thousand words. We only need seven: creating and sustaining an economic moat matters. From our vantage point, Publicis has done the best job of converting itself from a farmer to landowner (data owner). Whomever owns the best soil (data) in advertising land gets to build the biggest and durable moat. That seems to be Publicis’ acquisition strategy in a nutshell.
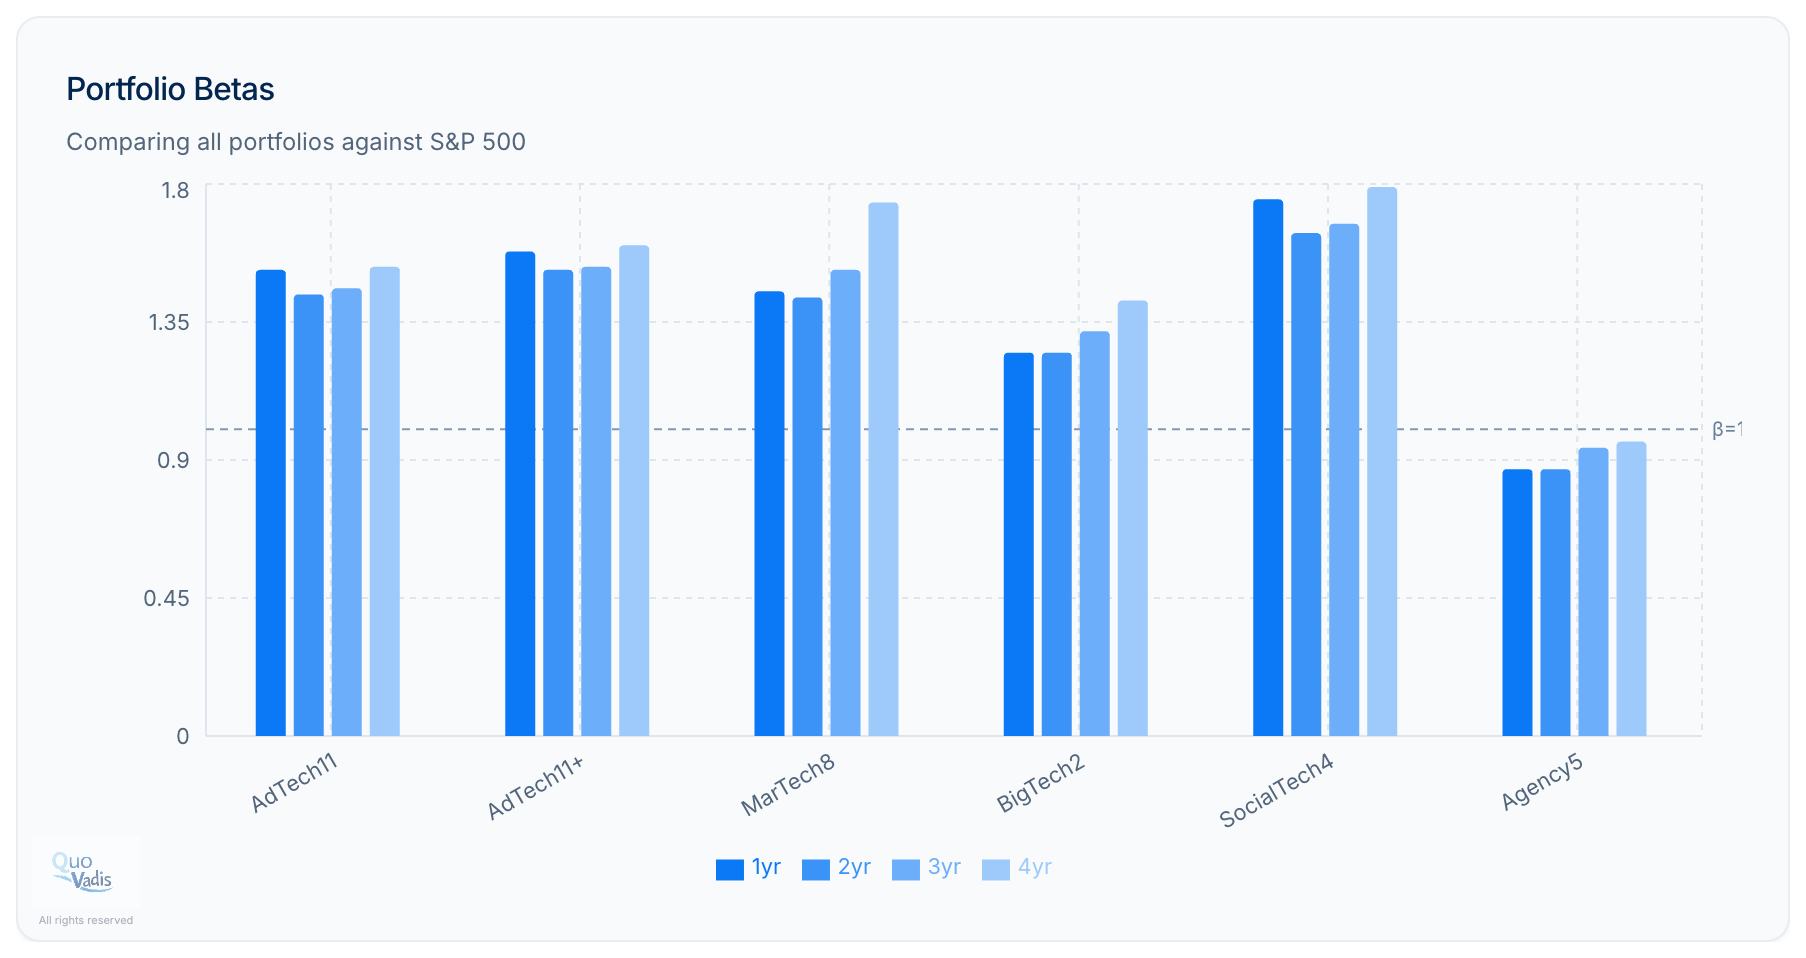
A word on Betas
Looking at betas across our AdTech and MarTech portfolios, they are relatively high, ranging from ~1.3 to ~1.8. High betas materially affect the cost of equity and the overall cost of capital. In a tightening cycle with AI opportunities and threats everywhere, players with higher discount rates disproportionately affect efforts to create long-duration cash flow streams. The result is valuation pressure and multiple compression, even if operating performance remains intact.
If you want to hear what the experts have to say about topics like this, then come to the Advertising Economic Forum NYC on March 18 and 19.
Disclaimer: This post, and any other post from Quo Vadis, should not be considered investment advice. This content is for informational purposes only. You should not construe this information, or any other material from Quo Vadis, as investment, financial, or any other form of advice.