
#147: The End of Headcount as We Knew It
Meta and Google reach headcount maturity; S&P500 companies AI laggards; Trade Desk revenue per employee is the Google/Meta club
Last Media Dollar Live Online Simultaneous Game on June 11, 10:00 AM ET
Quo Vadis is hosting a live, simultaneous online game where every attendee votes on media channels matchups in real time. This virtual event experiment promises to be the most unique content delivery experiment ever created and the most interactive content experience in the advertising space. There is nothing else like it. The gap between your voting instincts and the crowd’s is where the real learning happens. You walk away smarter, with a full breakdown of how the room voted, and get a results transcript in your inbox after the online event.
The end of headcount as we know it
There was a time when growth in technology followed a simple equation: More revenue required more people. The more an adtech company (or agency) grew, the more people it hired. As sales teams scaled and engineering teams expanded, the organizational chart (along with lower-cost outsourced staff) sprawled in lockstep with top-line growth. That basic equation has held for a long time.
Between fiscal year-end results in February and the latest Q1 earnings from both Google and Meta, it’s becoming clearer that the old equation no longer holds. Revenue for both companies is still growing at a double-digit pace, but headcount is flattening. We think the gap is one of the most important economic shifts in modern business (and a leading indicator for the sector), particularly for two companies that produce 45%+ return on invested capital and deliver very healthy operating profit margins (Google at 33% and Meta at 45%).
The first signal is evidenced by both companies reaching what we describe as headcount maturity.
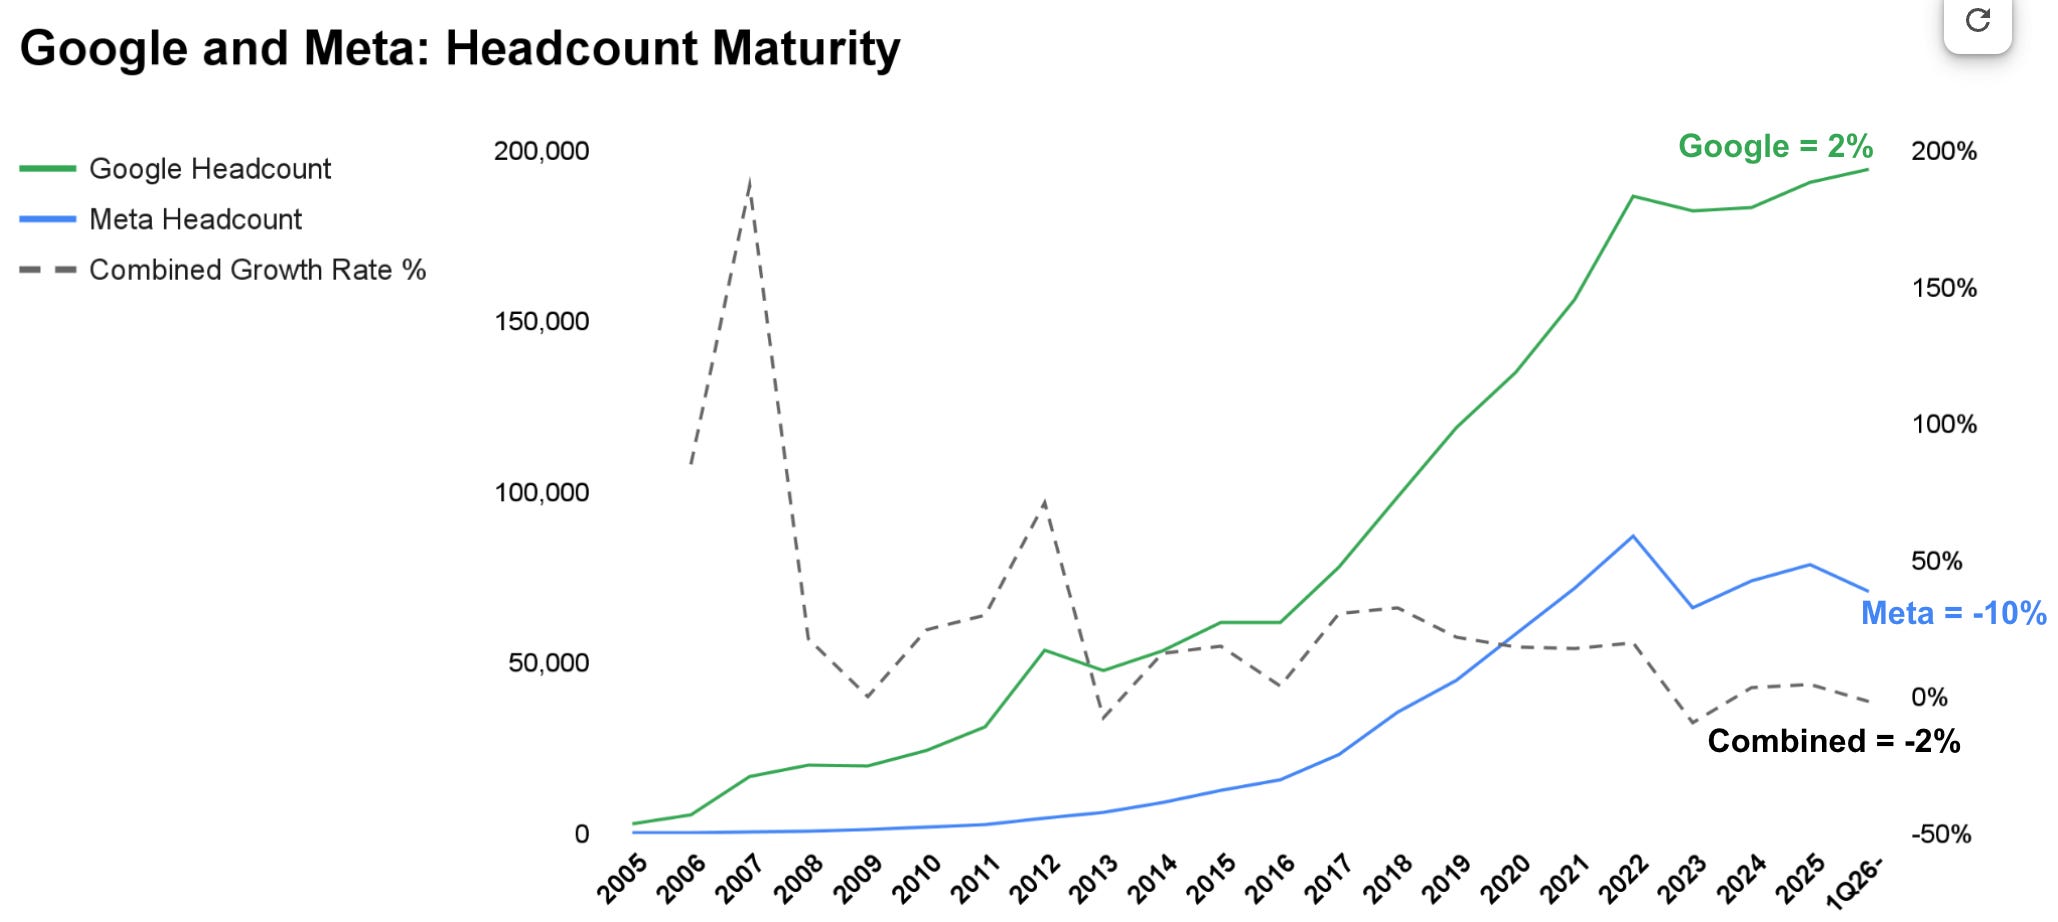
Google is approaching peak employment with ~190,000 employees and is now growing its workforce at roughly 2% annually. Meta has ~78,000 employees and will have ~70,000 after the May layoffs are complete, aiming to reduce staff by ~10%.
As our Quo Vadis readers know, we sometimes turn to historical S-curves because they generally give a good indication of what’s true. In our view, reaching peak headcount maturity at Google and Meta should not be viewed as cyclical belt-tightening nor a response to macro conditions. Instead, we think it characterizes the natural end state of a two-decade-old S-curve that followed the typical path of new innovation (e.g., search, social), build (easy-to-buy), scale (eyeballs), optimize to zero marginal cost, and reach maturity as massive cash-flow machines.
Susan Li (Meta’s CFO) reinforced the new circumstances on the 1Q earnings call:
“We ended Q1 with over 77,900 employees, down 1% from Q4 as the impact of headcount optimization efforts in certain functions was partially offset by hiring in priority areas of monetization and infrastructure.”
And more poinently, “Compute is becoming increasingly important as it determines the quality of the services we can provide, including powering more capable models and delivering innovative new products. It is also becoming more critical to how we work at Meta, as we are entering a world where employees are managing agents to help them generate new ideas, run experiments, execute tasks, and build products.”
Revenue Productivity
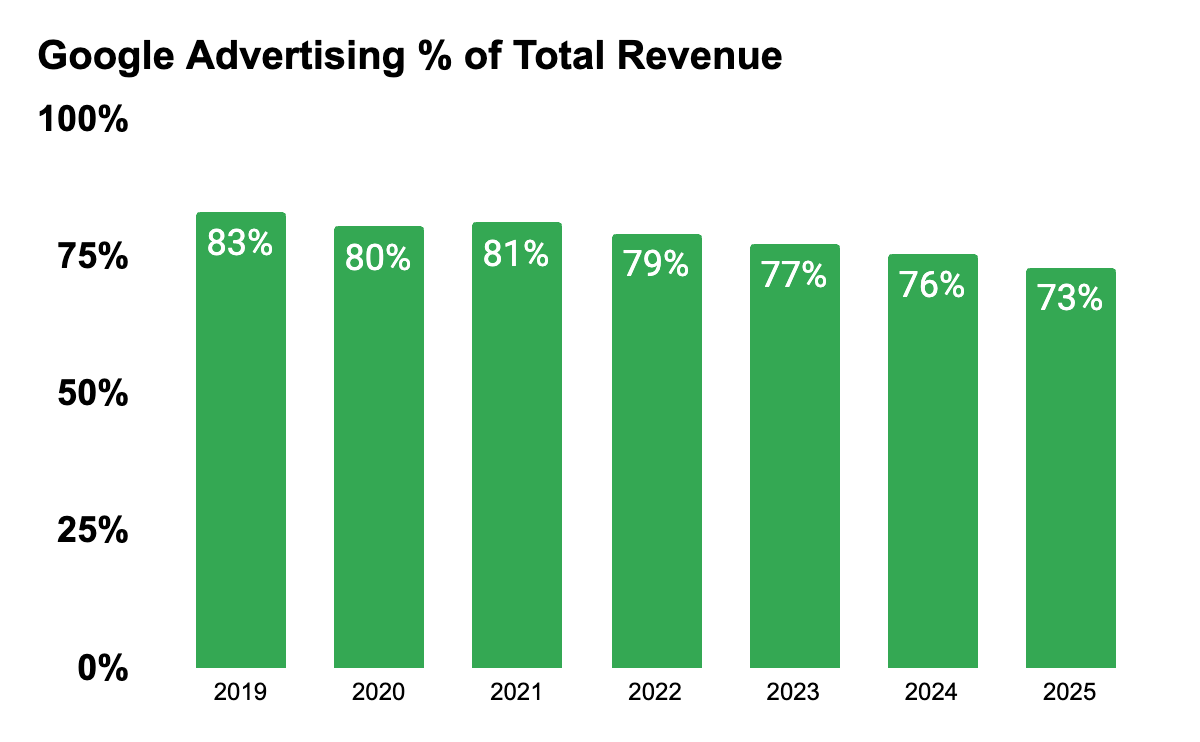
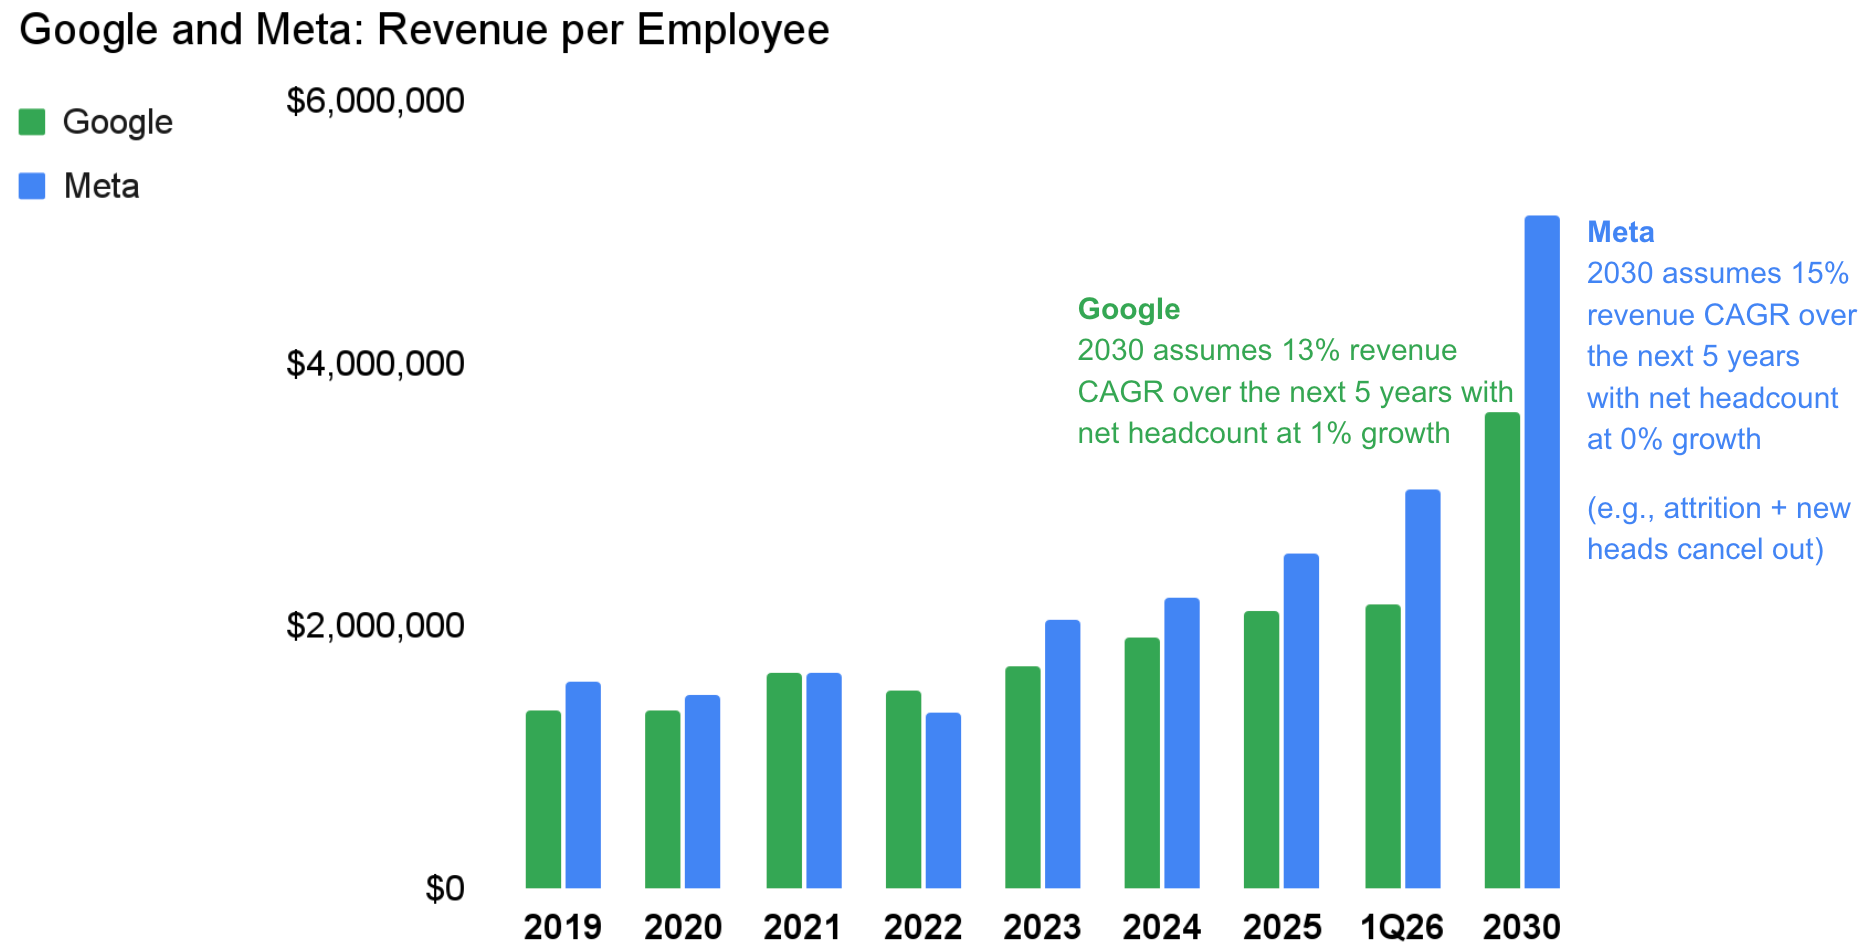
In 2025, Google generated just over $2 million in revenue per employee, and around the same amount if we examine only its advertising business (search, YouTube, display, etc.), more on that subject below. Notably, Google’s advertising revenue as a percentage of total revenue has fallen from 83% to 73% since 2019, while cloud has grown from 11% to 15%.
Meta’s business remains 98% ad-based, generating just over $3 million in revenue per employee. On its current growth trajectory, assuming reasonable revenue growth (e.g., 15% CAGR) and near-flat headcount over the next few years, revenue productivity will approach ~$4 million soon and ~$5 million+ by the end of the decade.
The mechanism behind this shift should not be mysterious to our readers. For Google and Meta, AI is a labor multiplier on top of strong operating assets, with employees (including lower-cost outsourced staff) increasingly operating less as executors of discrete tasks and more as system managers of agents that generate ideas, run experiments, write code, optimize campaigns, and build new products. Work that once required coordinated teams now collapses into a totally different orchestration of workflows.
Critically, the productivity gains are happening internally just as much as externally. The same models that power consumer-facing products are completely reshaping how these two companies operate internally and make decisions.
Historically, labor was the dominant input and largely fixed with a high correlation to revenue growth for both companies. Today, that relationship is flipping. Labor is becoming less fixed, while computing is becoming the scaling variable. The more that any given output is required, the more computing resources, rather than people, will be deployed.
But unlike labor, computing ability benefits from cost deflation and simultaneous rapid performance improvements over time. The result is an asymmetrical outcome in which variable costs will likely rise in absolute terms, but unit economic costs will decline on an increasingly lower fixed-cost base (lower staff costs).
So, if you’re wondering how Google and Meta will likely capture future benefits from massive capex on AI infrastructure, we recommend considering how the new variable-to-fixed cost paradigm will allow them to materially expand operating profit margins (cash in flows), thereby justifying all the capex with incremental cash flows. Given that Google and Meta generate ~45% and ~50% return on invested capital, respectively, and deliver massive economic profit spreads, we could make a strong argument that both companies are actually underinvesting in AI capex.
How about the broader market?
Zooming out to the broader market presents a stark contrast. We took a random sample of 46 S&P 500 companies and examined both revenue and headcount from 2010 onward (see list below in the footnotes1).
The average company has grown revenue at roughly 3.2% annually since 2010, with headcount growing at about 1.4%, and revenue per employee sitting below $500,000.
Compared to leading-edge, highly entrepreneurial companies like Google and Meta, other large “laggard” enterprises still operate with human-centric workflows designed for coordination, oversight, and incremental efficiency gains.
We can imagine these companies as slow-moving cargo ships. They set a course and sail in a straight line. They are hard to turn or change direction, because cruising in a straight line is the default risk-averse strategy.
If you've worked in a large organization, you've no doubt felt the pain of human-based process flow, process design, and redesign over the last few decades. As far as we can tell, the current process flows that most companies run today are incongruent with how AI works.
In other words, we imagine a phase currently underway in which large enterprises are getting (or are going to get) completely reimagined from their old processes into a new way of thinking that fits with how AI functions. Over the next few years, we'd expect to see a meaningful increase in revenue productivity across the board, as well as a meaningful expansion of operating profit margins.
Revenue growth grows in line with expectations (more or less)↑
Fixed headcount costs decrease↓
Revenue per employee↑
Variable costs increase with AI compute costs↑ (and eventually get reported as a new GAAP line item)
In summary, fixed costs decrease while variable costs increase, thus disproportionately benefiting the bottom line.
For Google and Meta, compute has become the central axis of capital allocation because the key question is no longer how many people to hire but how much infrastructure to deploy. We see companies like Google and Meta as leading indicators of what’s to come for all companies.
A number that will surprise many
When you compare advertising revenue productivity across the sector, The Trade Desk emerges as the frontrunner compared to Google and Meta.2 With an estimated $13 billion in gross billings through its platform and 3,843 employees, TTD’s revenue per employee exceeds that of both Google and Meta.
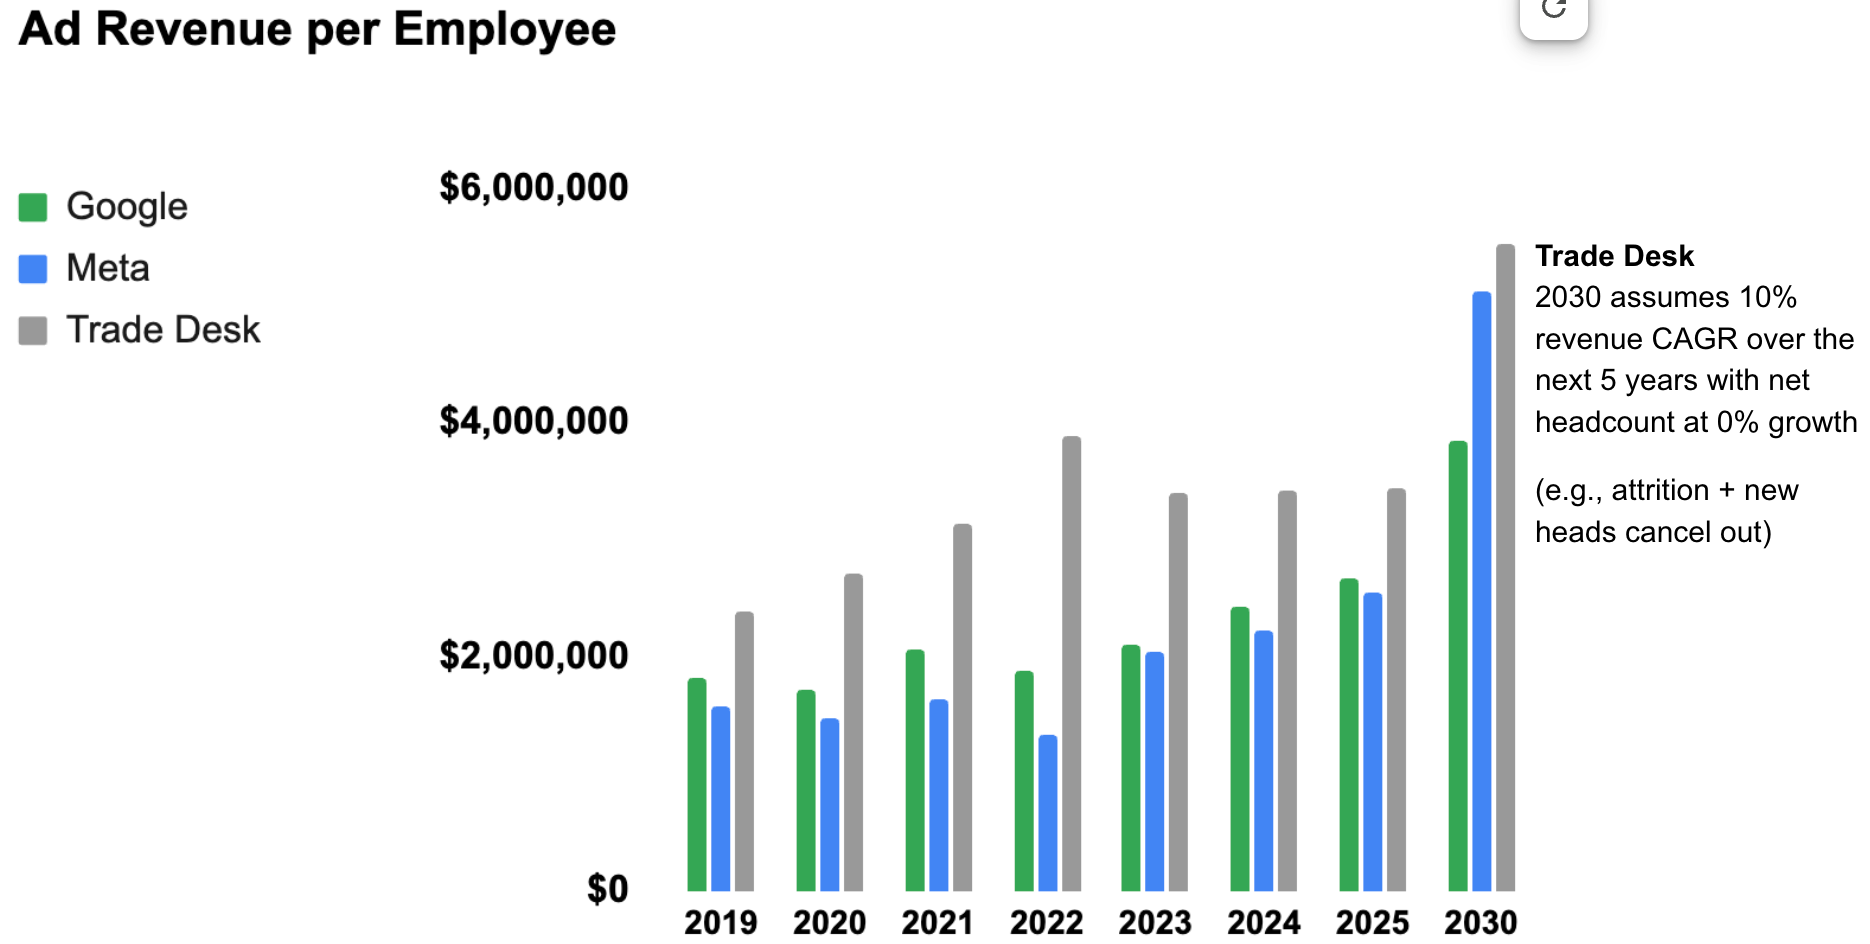
This is not because TTD has suddenly discovered AI leverage ahead of every other adtech company, but because it has been designed for efficiency from the outset. With so much attention on the mega players in the ad business (Google, Meta, Amazon), we suspect TTD’s revenue productivity goes mostly unnoticed.
What about agencies?
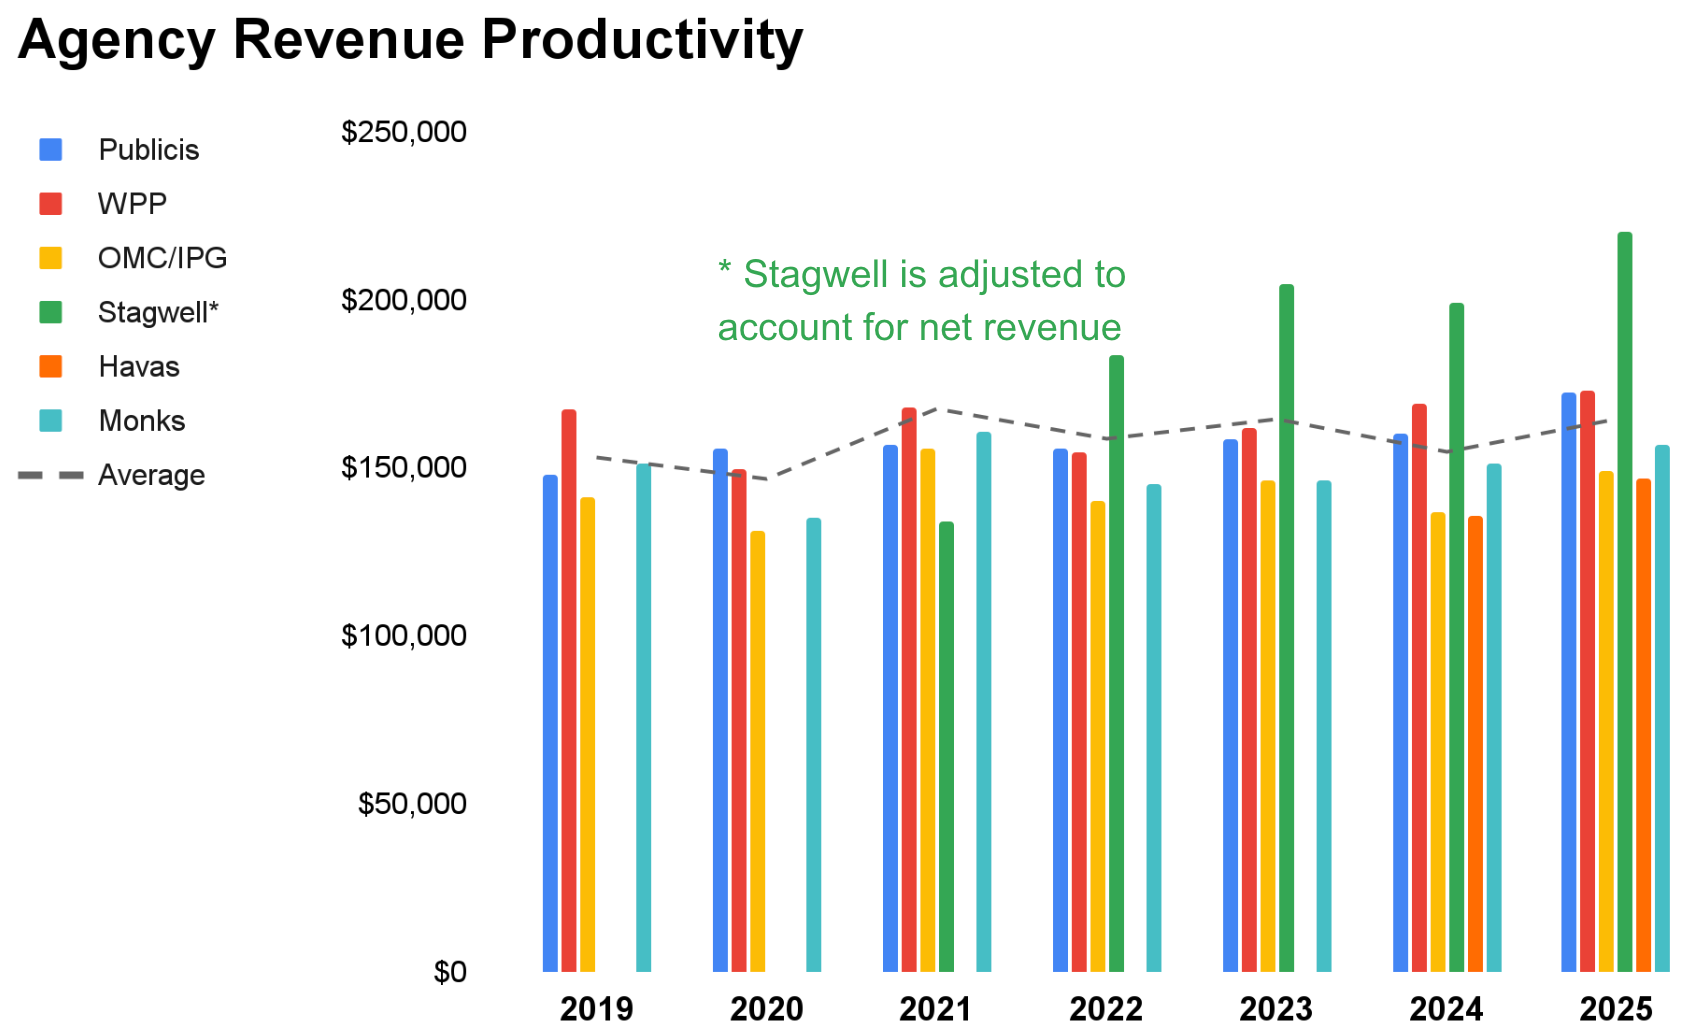
We’ve already established that the average revenue per employee across the S&P 500 is roughly $400K, yet across the very agencies those companies rely on for the advertising job done (Publicis Groupe, WPP, OMC/IPG, Stagwell, Havas, Monks), revenue productivity is closer to $160K.
Large advertisers generally operate with economies of scale and pricing power. They own the assets. They own products, audiences, and/or distribution to capture economic rents.
Agencies, by contrast, are a labor-based service layer. Agency headcounts tend to scale with sales (excluding Publicis as the best “rent collector” model across the agency scene), while their pricing is constrained by procurement, benchmarking, and CFO ROI scrutiny. In other words, agencies sit within the client’s cost base, not at the point of value capture, as they used to during the Mad Men days. This is precisely why any agency that can turn its value proposition into a driver of measurable and provable value capture (e.g., through outcome-based compensation) is in a winning position.
Up until recently, agencies have not been designed to maximize revenue per employee. They were designed to minimize client cost per loosely defined outcomes (or none at all). Their role was, and largely still is, to absorb complexity, aggregate expertise, get volume discounts, and convert what would be fixed costs for the client into semi-variable costs from the client’s perspective. If we boil it down, agencies basically operate as an outsourced execution layer to which procurement can flex up or down.
If you’re wondering why clients take this outsourced approach, I asked Brian Wieser the same question while sitting at an outdoor cafe in Cologne, Germany, during DMEXCO in 2015. His answer was brilliantly zen:
“Because agencies are the least-worst alternative.”
At face value, that sounds horrible. But in reality, it’s one of the best market positions a firm can possibly be in. Why? Because it implies switching doesn’t solve the problem. Clients rarely choose an agency because it's perfect. They’re choosing it because the trade-offs embedded in the other alternatives aren’t worth it.
Secondly, agencies don’t need to be exceptional every day. They just need to be consistently better than the next-best option (in-house, consultants, platform team, etc.). That’s simply a much easier position to defend over time than trying to be “best in class.”
Moreover, being the least-worst alternative creates a stable equilibrium.
When all players have flaws, and no clear dominant substitute exists, the market settles into a classic Nash equilibrium of acceptable satisfaction/dissatisfaction.
The reason clients don’t defect from agencies, even though they switch agencies all the time, is that no one expects to materially improve their outcome.
What does the future hold?
We believe large enterprises are highly likely to continue relying on agencies into the foreseeable future. However, while agencies are good at optimizing execution, they do not own the underlying economics. We think agencies will follow Publicis’ lead and take advantage of AI not just to increase revenue productivity, but to shift their business model from being farmers to landowners (data owners that collect recurring rents from clients in exchange for proven/believable outcomes).
Shifting from farmers to landowners is mission-critical for agencies to remain relevant in the coming years amid new entrants like AI tools and platforms with built-in AI. As we sit today, the new alternatives may look superior in isolation, but to displace the incumbent agency, they must be less flawed across the full stack (strategy, execution, scale, and integration).
That’s a much higher bar than most practitioners realize.
As new AI workflows across planning, trafficking, measurement, reporting, and optimization (in media and creative flows) become partially or fully automated, agency revenue will likely continue to grow at current rates while headcount declines naturally. Agencies have historically experienced relatively high annual attrition (~15–25%), so we expect them to leverage natural churn to gradually reduce labor intensity, thereby increasing revenue per employee toward a new, higher state.
The go-forward model is no longer “bigger is better.” It seems more likely that agencies will become thinner and serve clients as software-augmented coordination layers that also happen to play a market-maker role with trading inventory as principals.
Disclaimer: This post, and any other post from Quo Vadis, should not be considered investment advice. This content is for informational purposes only. You should not construe this information, or any other material from Quo Vadis, as investment, financial, or any other form of advice.
3M, Abbott, American Express, Apple, AT&T, Bank of America, Boeing, Bristol-Myers Squibb, Caterpillar, Chevron, Cisco Systems, Coca-Cola, Colgate-Palmolive, Comcast, Duke Energy, Exxon Mobil, FedEx, General Mills, Honeywell, Intel, Johnson & Johnson, JPMorgan Chase, Kimberly-Clark, Lockheed Martin, Mastercard, McDonald's, Merck, Microsoft, Mondelez, Morgan Stanley, NextEra Energy, Nike, Northrop Grumman, Oracle, PepsiCo, Pfizer, Procter & Gamble, Southern Company, Starbucks, Goldman Sachs, Home Depot, UPS, Verizon, Visa, Walmart, Wells Fargo.
We estimated the number of employees in Google Advertising by allocating Alphabet’s total workforce across segments using financial proxies. First, we split total employees between Google Services and Google Cloud based on each segment’s share of employee compensation, assuming compensation scales with headcount. This yielded roughly two-thirds to three-quarters of employees in Services across the period. Next, within Services, we allocated employees to Advertising using the revenue mix. Since Advertising represents ~86–87% of Services revenue, we applied that proportion to the Services headcount. This two-step allocation (compensation share to segment headcount, then revenue share to sub-segment headcount) produces an estimated ~110,000 employees working in Google Advertising.