
#145: Apples to Apples, When GAAP Accounting Distorts Reality
A Case of Company A vs. Company B

Let’s say we are examining AdTech Companies A and B. On the surface, Company A appears to be the clear winner, with faster revenue growth and a higher Rule of 40 (revenue growth + EBITDA margin).
Company B, by contrast, has different optics at first glance. Slower revenue growth, but better EBITDA margins and a slightly lower Rule of 40. Beneath the surface, Company B’s economics show a more efficient adtech machine.
The first apples-to-apples mistake observers tend to make is miscalculating EBITDA margins off the wrong “revenue” number.
Company A reports actual revenue earned ($2.9 billion in 2025) from processing gross ad spend. EBITDA was $697 million, so its EBITDA margin is 24%.
Company B reports revenue in terms of gross spend, $1.9 billion in 2025. If we incorrectly apply it to EBITDA, we get a 17% margin. Company B’s actual revenue (aka, ex-TAC contribution) is $1.2 billion, so its correct apples-to-apples EBITDA margin is 27%.
The second mistake is caring about EBITDA in the first place. EBITDA is only somewhat relevant if you’re interested in pricing a company (e.g., using comparable company multiples to “value” a target company). EBITDA is widely used because it is easy to calculate, but it is insufficient for properly valuing a company.
Let’s start with Company A
Reporting Guidelines: Company A reports under a GAAP “Agent” model. That means it only records the cut it keeps (its commission or take rate) as revenue, not the full amount of money flowing through its platform.
Revenue: Company A’s revenue in 2025 was $2.9 billion. YoY revenue growth was 18%. Not too shabby. Consensus estimates for 2026 revenue growth range from 13% to 15%. The company faces multiple headwinds, making the low end of the range a real possibility.
Gross Ad Spend: Company A processes or “sees” around $14.3 billion in media flows (~20% disclosed take rate). Before the 2025 reporting year, the company used to provide investors with information about the volume of gross ad spend it processes, but it seems management decided to remove past transparency. In our view, the main reasons likely reflect a combination of mix shift, reporting simplification, and/or underlying volume/take rate dynamics. In any case, we use either accounts receivable (audited number) or accounts payable (audited number) and look at historical days receivable or days payable to get a good enough idea of gross ad spend.
EBITDA and EBITDA Margin (Earnings Before Interest, Taxes, Depreciation, and Amortization): Company A generated $697 million in EBITDA in 2025. Creating EBITDA margins in adtech land north of 20% is not easy. Company A generated 24% EBITDA margins in 2025.
Capitalized R&D Expense: One of the first steps in valuing any tech company is to depart from GAAP by capitalizing all R&D expenses. This approach provides a more accurate view of operating profits. Given the state of rapid technological change, we amortize on a 3-year schedule
Here’s what NYU valuation guru, Aswath Damodaran, recommends, and we follow his advice:
“Expensing R&D leads to lower earnings and book values for firms that invest heavily in it, making them look less profitable than they truly are… by treating R&D as an expense rather than a capital investment, we systematically understate both earnings and invested capital for growth firms.”
Read Damodaran’s persuasive view in: “Research and Development Expenses: Implications for Profitability Measurement and Valuation Aswath Damodaran, Stern School of Business.
So, after we capitalize R&D expenses, the net effective is to add back $108 million in R&D expense to Company A’s EBTDA, then subtract $49 million. The net effect is $59 million in additional EBITDA gains for Company A, bringing total EBITDA to $756 million. Now, in real operating terms, Company A’s true operating EBITDA margin is 26%.
Rule of 40 is a finance rule of thumb and a quick way to gauge whether a company is balancing growth and profitability well. You simply add the revenue growth rate to EBITDA margin. If the total is 40% or higher, the company is generally considered “healthy.” As a company matures, revenue growth is high in the early years and eventually decays toward GDP growth (e.g., ~4%). EBITDA margins behave in the opposite direction, starting low or negative and growing over time. For Company A, its Rule of 40 in 2025 was 44%.
Turning to Company B
Reporting Guidelines: Company B reports GAAP revenue under both the “Principal” and “Agent” models. When a company acts as a principal, that means it serves as a middleman, buying and reselling the product. In this case, GAAP requires recording the full sale amount as revenue and payments to suppliers as costs, leaving the difference as actual revenue (aka, ex-TAC contribution).
When we determine that we act as principal, we recognize revenue and related costs incurred on a gross basis. When we act as an agent, we recognize revenue on a net basis.
Revenue: Company B’s actual operating revenue in 2025 was $1.2 billion. YoY revenue growth was 5%. Keep in mind, Company B is four years older than Company A, and revenue growth rates for every company ever created always decay over time. We’ll come back to this important value driver later on in the article.
Gross Ad Spend: Company A operates under a single business model. Company B runs a diversified business model across two revenue streams. On its principal-based stream, it processed $1.7 billion in gross ad spend in 2025, netting $915 million in operating revenue (principal-based accounting). Its agent-based revenue stream generated $260 million, so total operating revenue in 2025 was $1.2 billion.
EBITDA and EBITDA Margin: GAAP EBITDA for Company B was $313 million in 2025, resulting in a nice 27% EBITDA margin. After we capitalize R&D expense and smooth out amortization as we do for Company A, Company B’s actual EBIDA margin is 28% compared to 26% for Company A.
Rule of 40: Adding revenue growth and EBITDA margin, Company B delivered a healthy 33% in 2025 compared to Company A’s at 44%.
A better measure of true health
“Every time you see the word EBITDA, you should substitute the words “bullshit earnings.”
— Charles Munger and Warren Buffet
Warren Buffett and Charles Munger famously despise EBITDA, viewing it as a misleading metric that ignores real cash expenses like capital expenditures. They argue it allows management to inflate earnings and mask a company’s true, often decaying, financial health.
A better measure of any company's true health results from doing the grunt work to understand the historical spread between return on invested capital (ROIC) and its cost of capital. Using EBITDA to price a company misses the two most important things to properly value a company:
Economic Spread: A company can create value only when its ROIC exceeds its cost of capital. Both companies A and B are creating value for shareholders, although one is better than the other.
Fundamental Growth: This is the rate at which a company can grow its operating profits, which is solely determined by how much of its operating profits it reinvests (Investment Rate) and how efficiently that capital generates returns (ROIC). In plain terms, growth isn’t just about investing more; it’s about investing well.
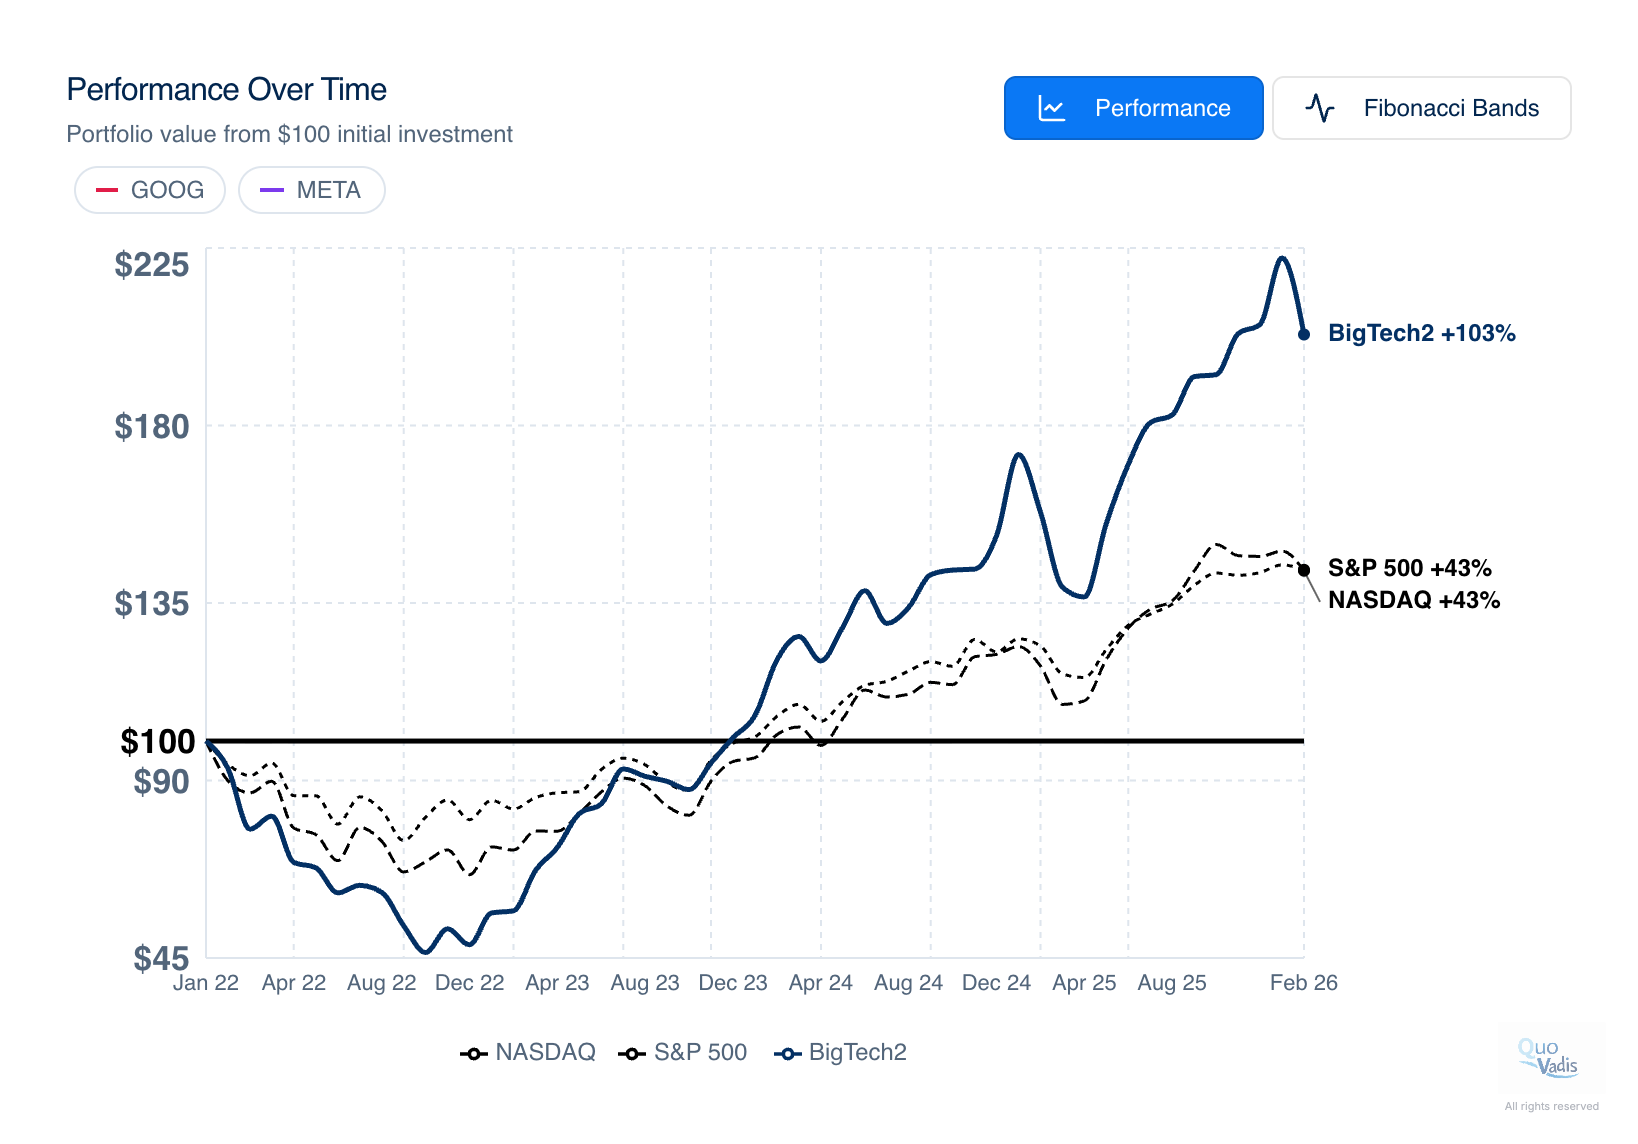
Before we compare Companies A and B on a true historical health basis, we need to establish two gold-standard benchmarks across the adtech space that any investor can use to allocate capital. The two high bars everyone looks up to are Google and Meta. Both companies consistently deliver ~45% ROIC (amazing). Since Total Share Returns ultimately map to ROIC performance, you can see the results for yourself in our Quo Vadis BigTech2 portfolio.
In the adtech world, Google and Meta have proven to be far and away the best allocators of capital. That’s why they are the gold standard for investors. That’s also why they can announce ~$150B in new invested capital aimed toward AI and get a favorable reaction from Wall St. They aren’t investing in AI” as a project. They are both completely retooling their entire production function around AI. They are defending and rebuilding their respective moats while simultaneously building AI utility layers. Both companies are asking and answering the right question:
How much capital is required to preserve ROIC in a world where intelligence is computational discipline?
The answer is a lot more than in the pre-AI digital advertising era.
Company A:
ROIC in 2025 was 29%, and its two-year average was 24%.
Since 2019, the average ROIC for Company A is 20%
Key Value Metric: Its economic spread relative to its 2-year average ROIC was 14% at an 11% cost of capital in 2025. Overall, the company’s average economic spread since 2019 is 8%. The economic spreads for Google and Meta (and Publicis too) are north of 30%.
Company A’s average growth rate of new invested capital since 2019 is 23%.
Over the same time period, its average revenue growth rate was 28%. Invest to grow, that’s the name of the game.
In terms of capital efficiency, the company generated $1.40 in revenue per dollar of invested capital in 2025. Not only would investors prefer to see this driver above 2.0, but their expectations are also heading to the 3.0 range with AI in the mix.
Company A’s current cost of capital for FY25 was 11.6%, averaging 12% since 2019, with minor variation across its capital structure.
Fundamental Growth: Since 2019, Company A has reinvested 95% of its operating profit into new invested capital, with an average ROIC of 20%, resulting in a healthy fundamental growth rate of 19% (the same rate as revenue growth in 2025).
Company B:
ROIC in 2025 was 20%, and its two-year average was 29%.
Since 2019, the average ROIC for Company B is 18%
Its economic spread relative to its 2-year average ROIC was 10% at an 9% cost of capital in 2025.
Key Value Metric: Overall, the company’s average economic spread since 2019 is 10%, 2% better than Company A.
In terms of capital efficiency, the company generated $1.60 in revenue per dollar of invested capital in 2025 compared to $1.40 for Company A.
Company A’s current cost of capital for FY25 was 8.8%, and averages 7% since 2019.
Fundamental Growth: Since 2019, Company A has reinvested 25% of its operating profit into new invested capital, with an average ROIC of 17%, resulting in a fundamental growth rate of 4% (the same rate as revenue growth in 2025).
The Future: DCF valuation comparison
Ultimately, what matters most is the forward view because valuation is driven by the future stream of free cash flow a business is expected to generate, not what it has already done.
Company A
Current market cap (equity value) is $10.1 billion.
Given multiple headwinds, we forecast 13% revenue growth in 2026 and 9% CAGR through 2030.
Company A generates $750K in revenue per employee. We expect this key value driver to improve in 2026 with investments in labor productivity, resulting in flat employee growth.
We expect continued improvement in operating profits, which implies ~30% EBITDA margins in 2026.
For 2026, we expect the company's ROIC to rise from 29% to 33%, and reach 37% by 2030.
Equity Valuation: Given $1.3 billion excess cash and $437 million in debt + debt equivalents, our fair market valuation for Company A is $11.4 billion. Company A’s stock is trading at $10.2 billion today, so we think investors are slightly undervaluing the company’s future prospects.
Company B
Current market cap (equity value) is $857 million.
Consensus estimates imply 2% revenue growth in 2026. We think management will easily deliver 5% growth in 2026 and maintain that rate through our 2030 forecast period.
Similar to Company A, we expect continued improvement in operating profits driven by AI labor productivity, implying 32% EBITDA margins.
For 2026, we expect Company B’s ROIC to rise from 20% to ~23%, and reach 31% by 2030
Rule of 40 by the end of 2026 will tighten: Company A at ~43% vs. Company B at 37%.
Equity Valuation: Given $250 million excess cash and $155 million in debt + debt equivalents, our fair market valuation for Company B is $3.4 billion. Company B’s stock is trading at $860 million today. From our vantage point, we think investors are massively undervaluing the company’s future prospects on what are fairly easy hurdles for management to achieve.
The Big Reveal
Bottom Line: Fundamentals and market narratives don’t always move in lockstep, but they eventually reconcile. Markets often misprice trajectory, but they rarely misprice destination over time.
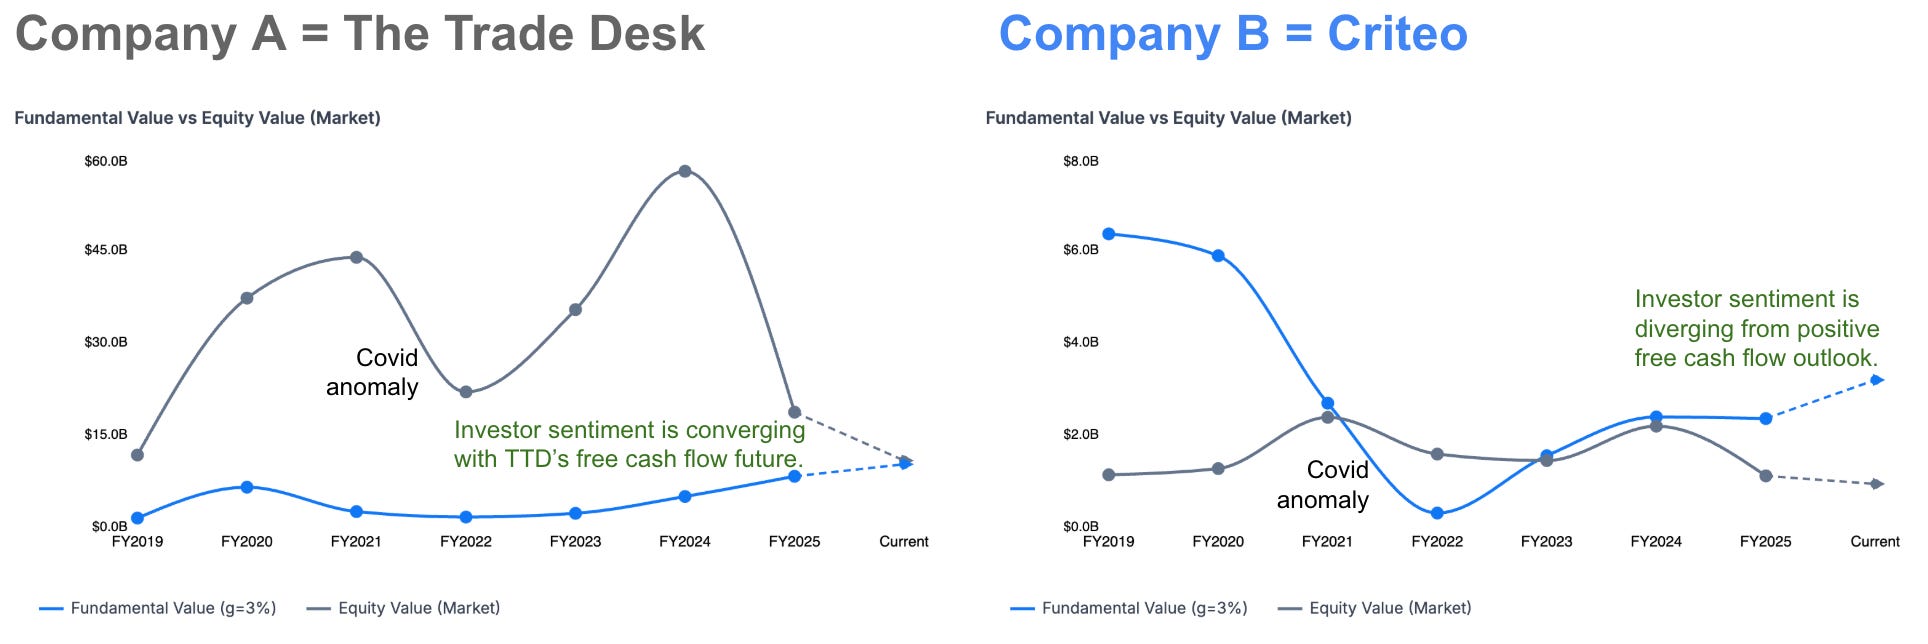
For The Trade Desk, the gap between market value and fundamental value has historically been wide, reflecting periods of both exuberance and skepticism. But today, that gap is narrowing. As free cash flow scales and reinvestment efficiency improves, investor sentiment appears to be converging toward the business's underlying economics.
For Criteo, the opposite dynamic is emerging. While fundamental value, driven by steady free cash flow, remains stable to improving, market valuation is still lagging (for now). From what we can observe, investor sentiment is diverging from operating performance, suggesting either a lack of conviction about durability (wait-and-see mode) or a meaningful and temporary mispricing of cash-flow quality.
Disclaimer: This post, and any other post from Quo Vadis, should not be considered investment advice. This content is for informational purposes only. You should not construe this information, or any other material from Quo Vadis, as investment, financial, or any other form of advice.